The software, downloadable from this web page, can be used to estimate more than 50 monthly, seasonal, and annual variables, including many economically or biologically relevant variables such as growing and chilling degree days, heating and cooling degree days, Hargrave's moisture deficit and reference evaporation, beginning and end of the frost-free period, etc.
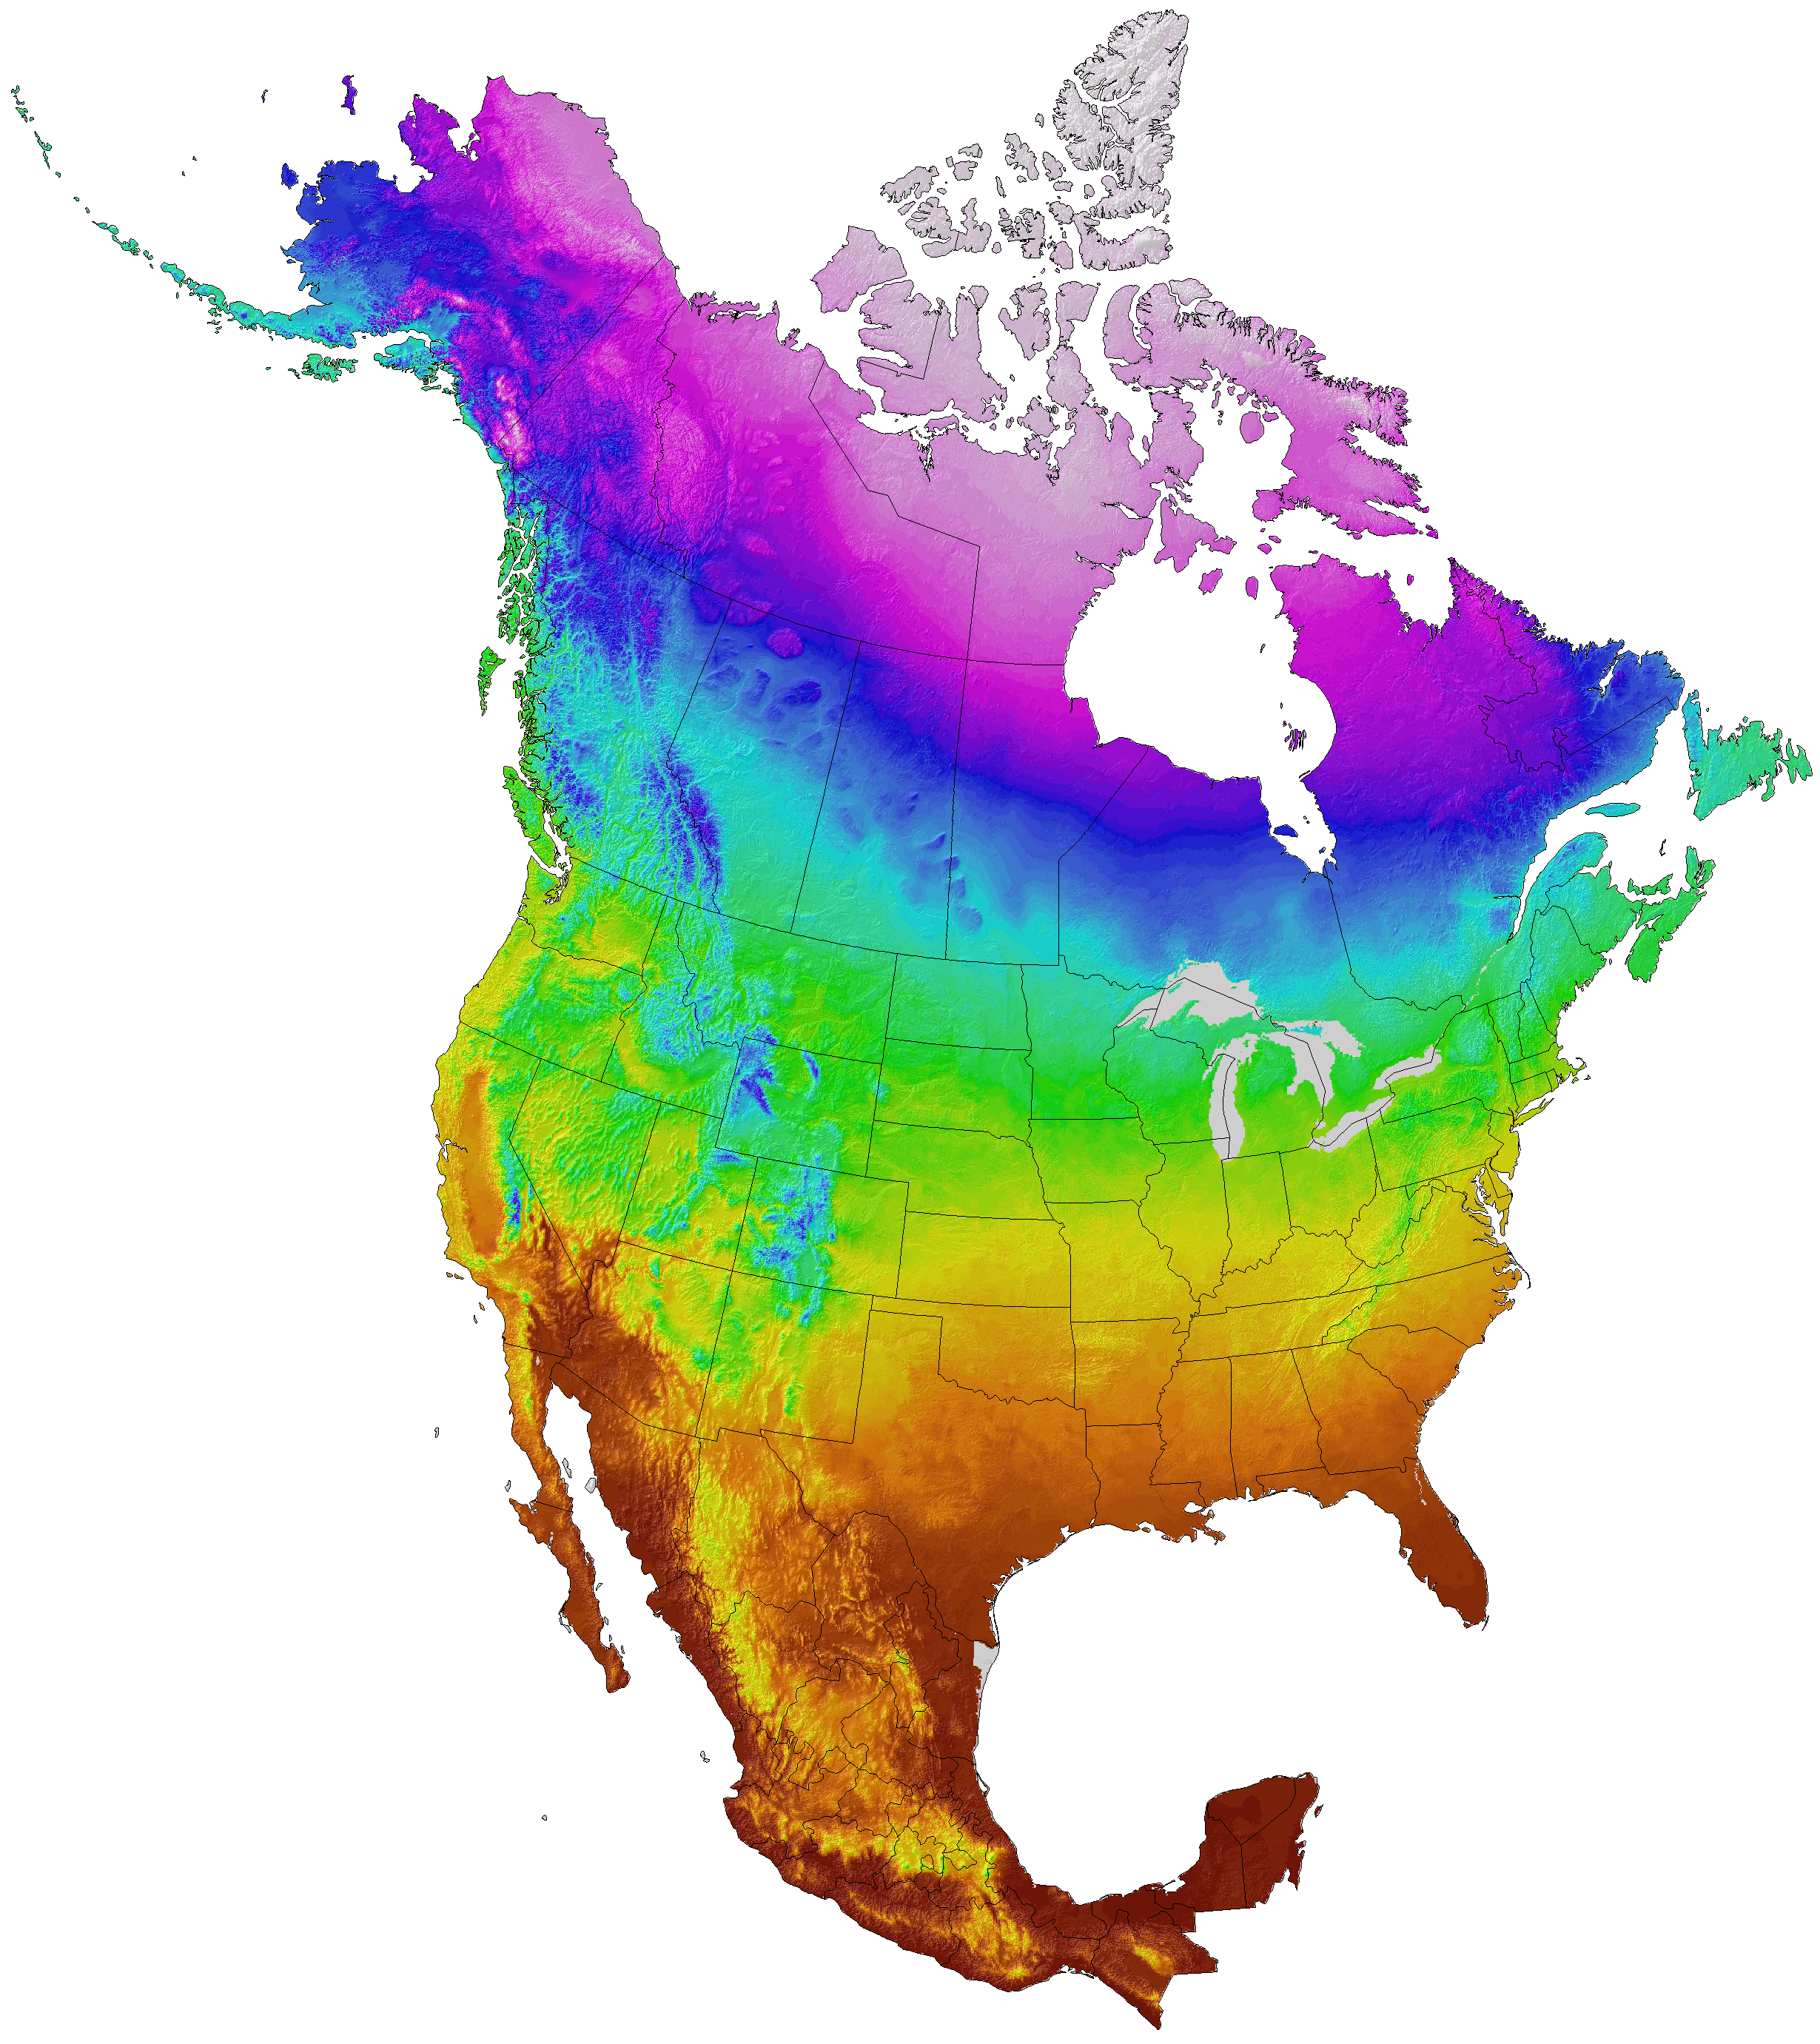
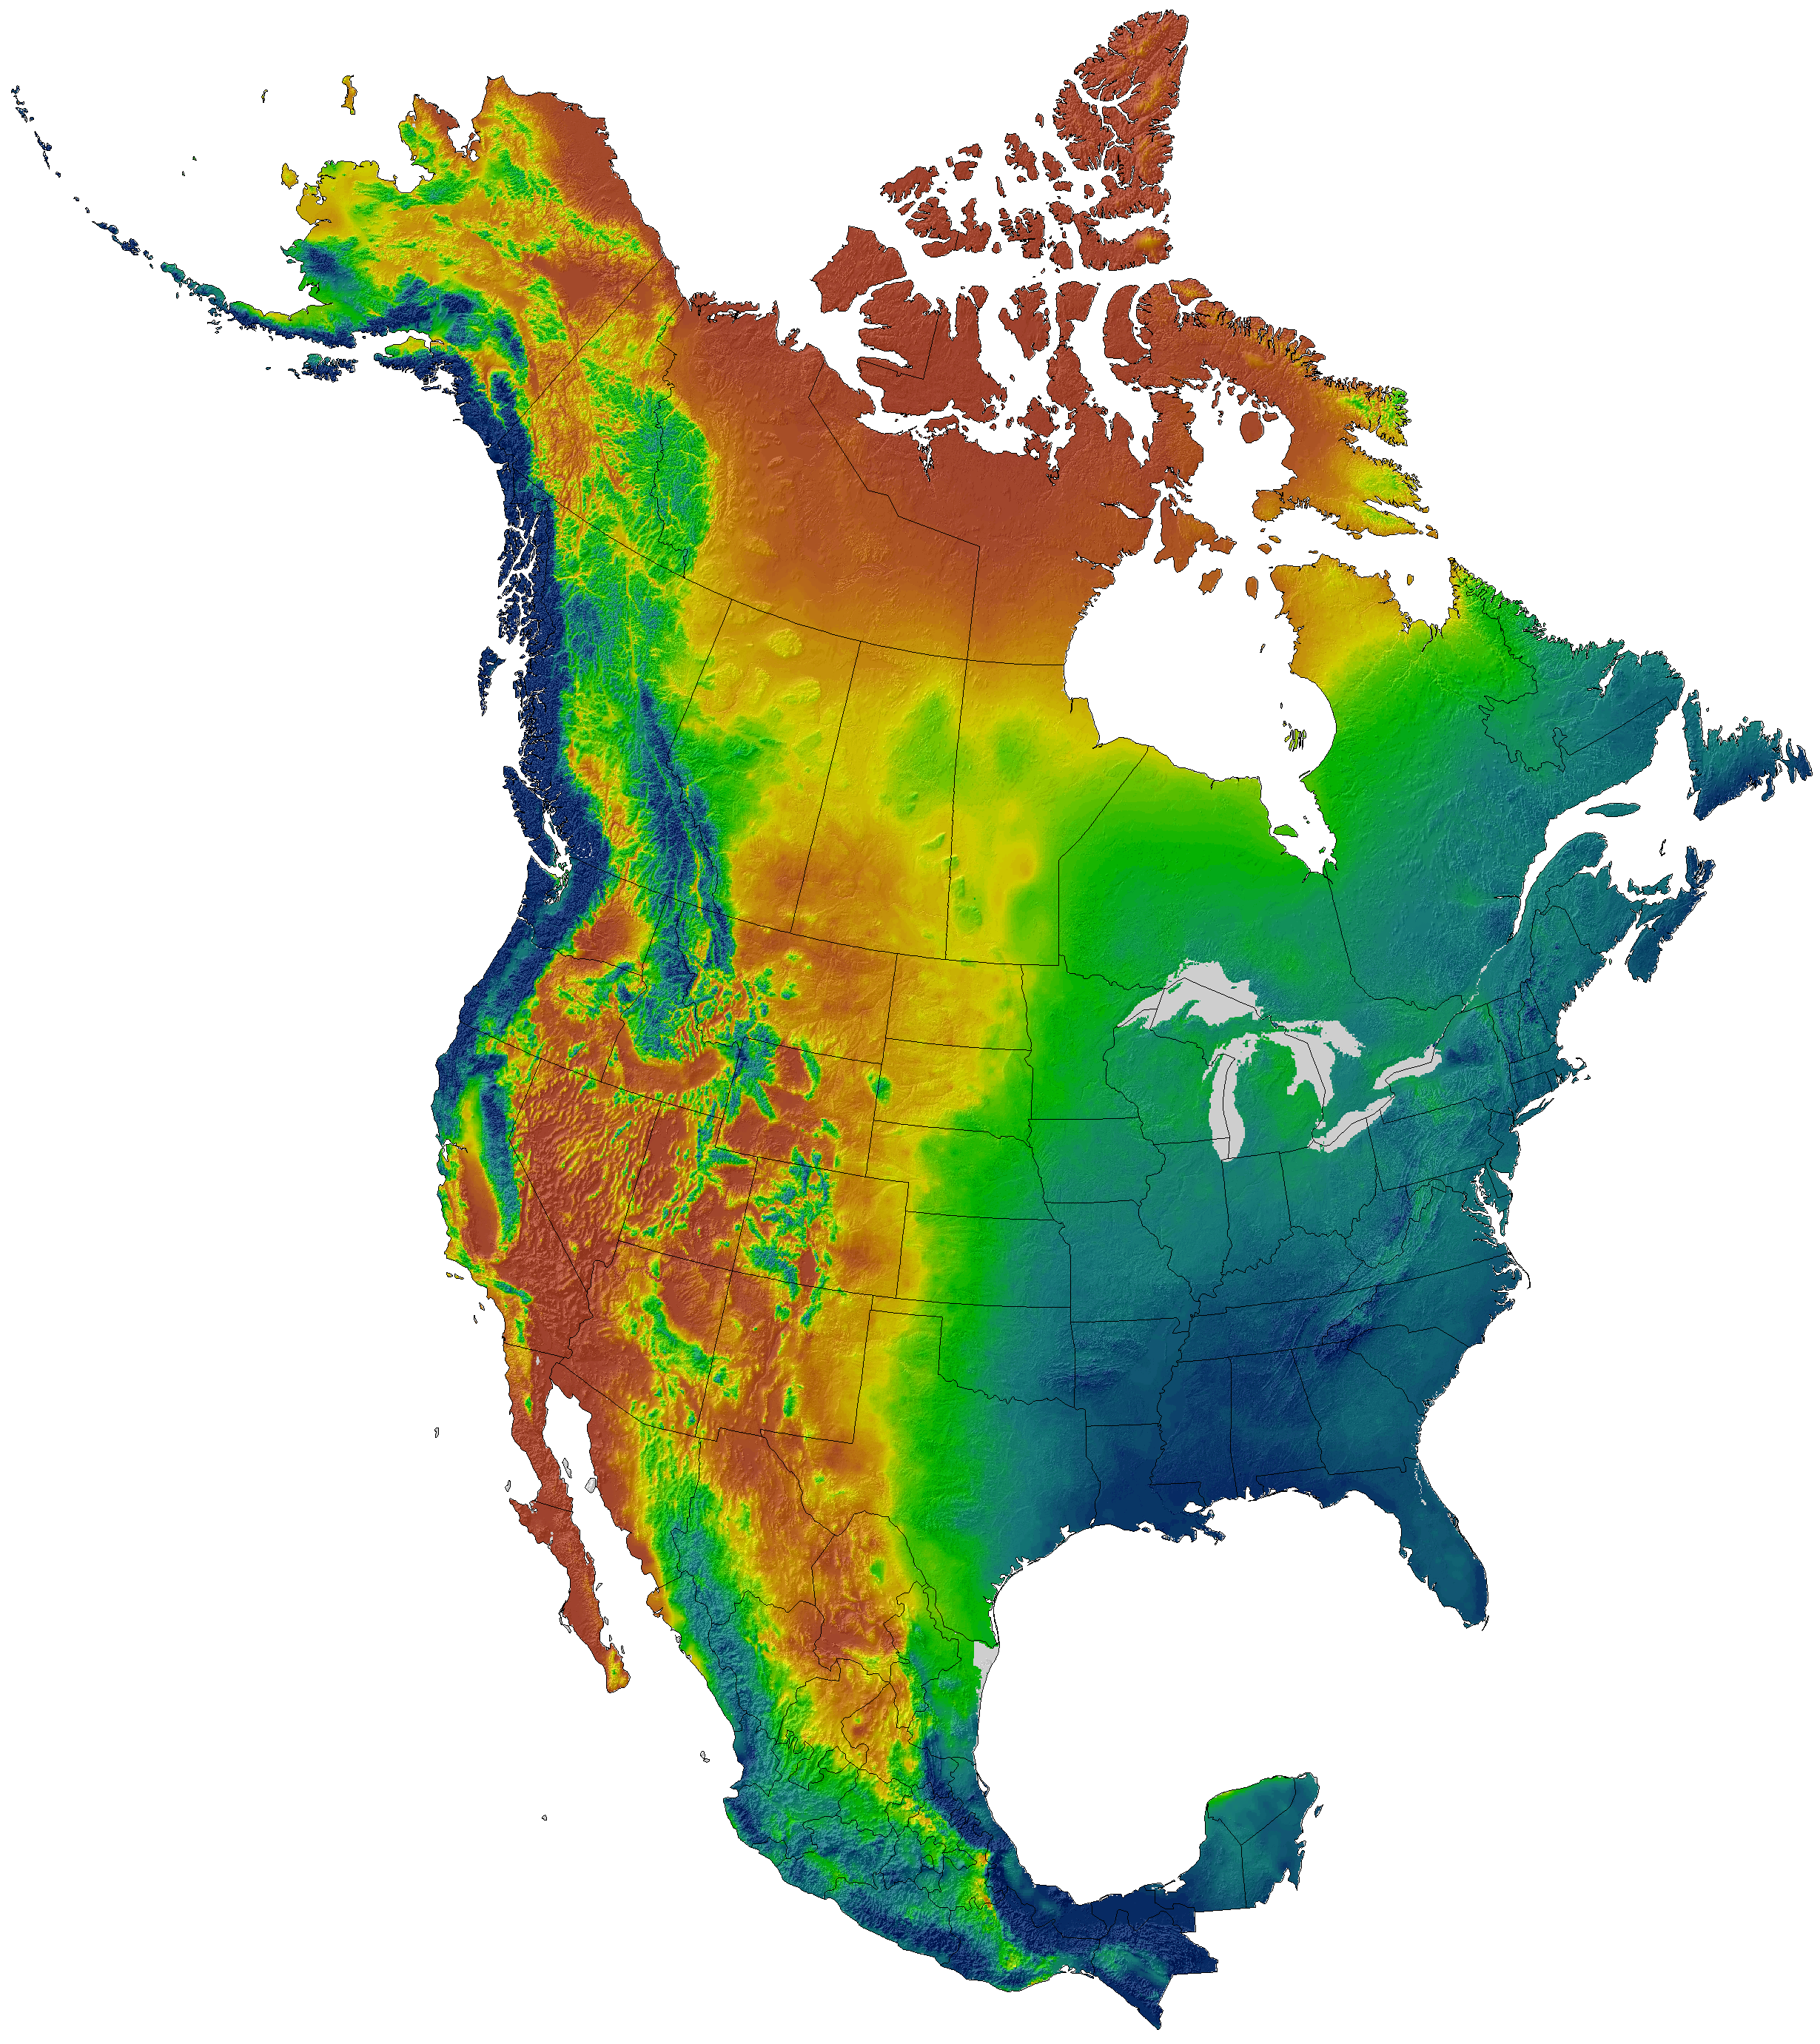
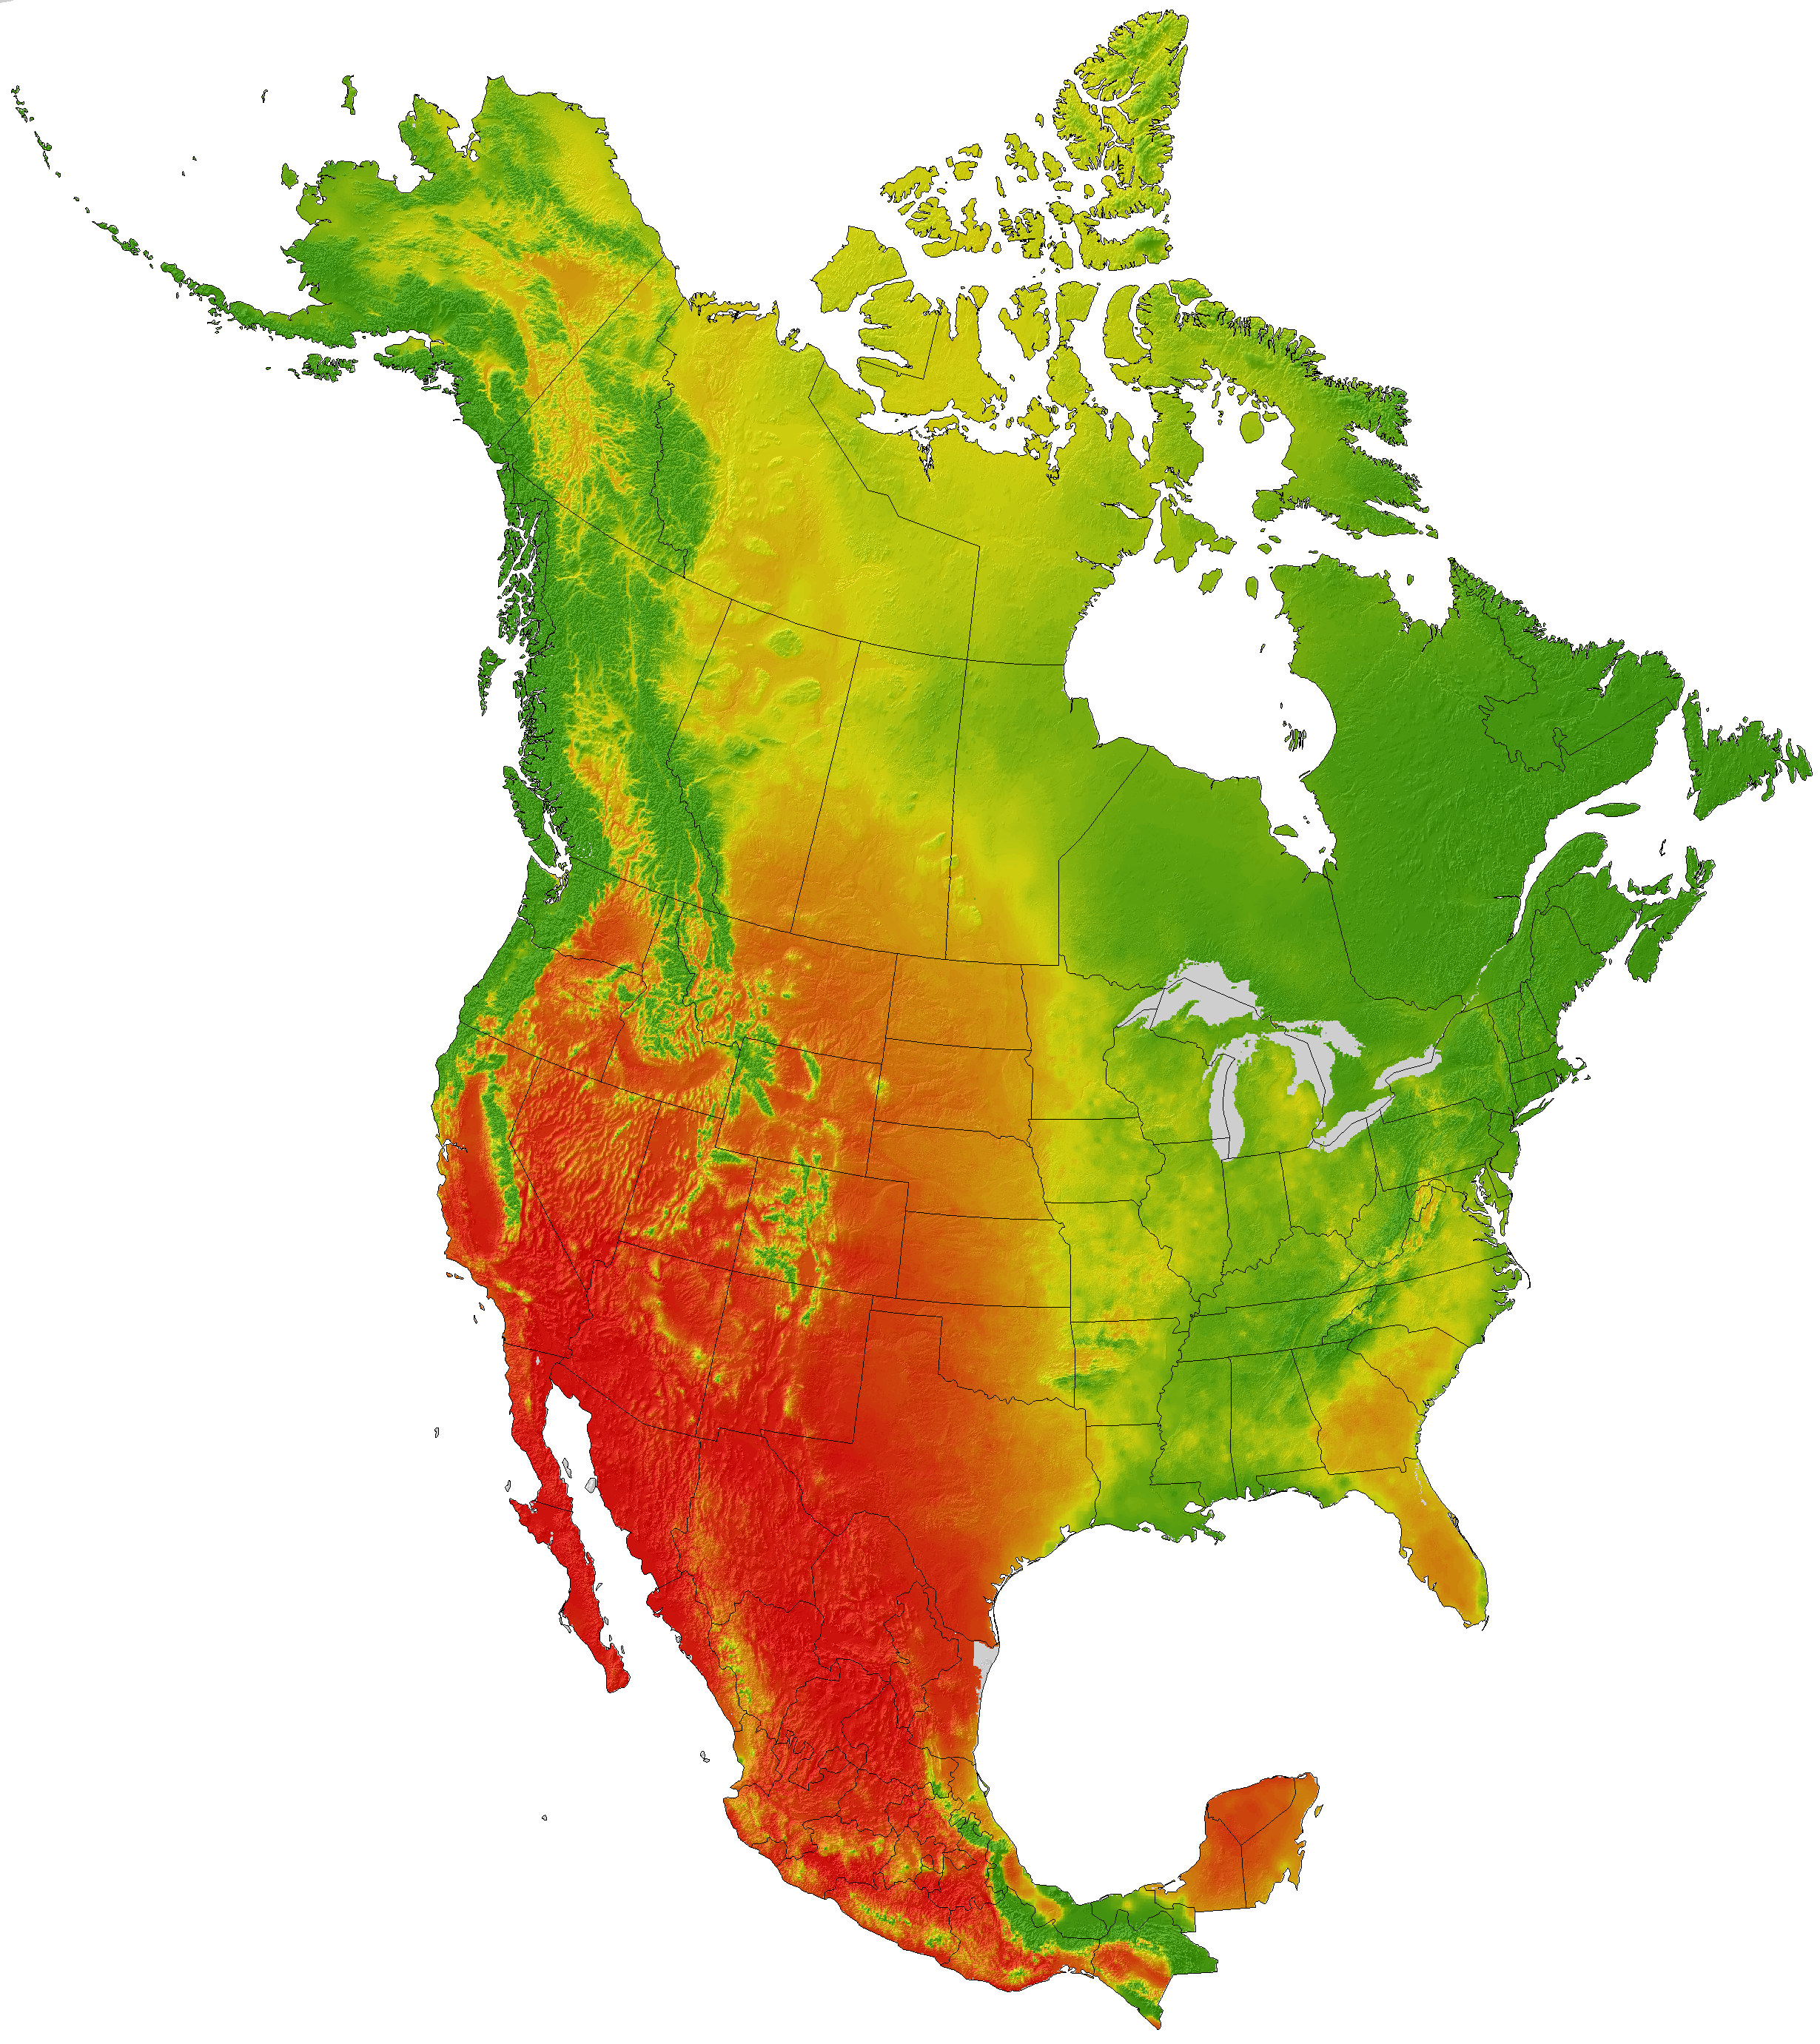
Click on the thumbnails below and use the zoom tool ![]() to see high resolution images of mean annual temperature (MAT), mean winter temperature with inversions in northern mountain valleys (MWT), mean annual preciptiation with leeward rainshadows (MAP), and a climate moisture index (CMI):
to see high resolution images of mean annual temperature (MAT), mean winter temperature with inversions in northern mountain valleys (MWT), mean annual preciptiation with leeward rainshadows (MAP), and a climate moisture index (CMI):

The reference climate grids are based on the Parameter Regression of Independent Slopes Model (PRISM) interpolation method for current climate. Historical data covers 1901-2020 are based on the CRU-TS 4.05 dataset (Harris et al, 2020, Scientific data 7: 109). Future projections are based on 15 AOGCMs of the CMIP5 multimodel dataset corresponding to the IPCC Assessment Report 5 (2013) x 2 Emission Scenarios (RCP4.5 and RCP8.5) x 3 standard time-slices (2020s, 2050s, 2080s). Average projected global warming increase (and likely range) for RCP4.5 are: +1.4°C (±0.5) by the 2050s; +1.8°C (±0.7) by the 2080s. For RCP8.5 they are: +2.0°C (±0.6) by the 2050s; +3.7°C (±0.9) by the 2080s.
The 15 AOGCMs are CanESM2, ACCESS1.0, IPSL-CM5A-MR, MIROC5, MPI-ESM-LR, CCSM4, HadGEM2-ES, CNRM-CM5, CSIRO Mk 3.6, GFDL-CM3, INM-CM4, MRI-CGCM3, MIROC-ESM, CESM1-CAM5, GISS-E2R and were chosen to represent all major clusters of similar AOGCMs by Knutti et al (2013). Within clusters, we selected models that had high validation statistics in their CMIP3 equivalents.
Downloads and References
This program does not require installation. Download, unzip, and double click the executable file ClimateAB.exe. The program should run on all versions of Windows. If you receive the error message "COMCTL32.OCX missing", you have to install these libraryfiles. The program also runs on Linux, Unix and Mac systems with the free software Wine or MacPorts/Wine).

This software version uses different historical data than the official release available at http://climatena.ca. We suggest the following wording to reference data usage: "Climate data has been generated with the ClimateNA v6.40b softwarepackage, available at http://tinyurl.com/ClimateNA, based on methodology described by Wang et al. (2016)."

Download links for CMIP5-based climate data (1km resolution)
This dataset was created by Carlos Carroll, David Roberts, and Andreas Hamann under the AdaptWest project, funded by the Wilburforce Foundation. It is based on the Parameter Regression of Independent Slopes Model (PRISM) interpolation method for current climate, and the Coupled Model Intercomparison Project phase 5 (CMIP5) database corresponding to the 5th IPCC Assessment Report (2013). Download and unzip with http://sourceforge.net/projects/sevenzip/
Note that the Chrome browser blocks the download links below. Use Microsoft Edge or Firefox for downloading from this page.
27 Bioclimate variables (1961-1990 normal period) |
48 Monthly variables (1961-1990 normal period) |
Reference files: Elev, ID, Boundary |
Meta data: Projection, Variables |
|---|---|---|---|
| ASCII: |
ASCII: |
ASCII, Shape: |
Readme: |
Average ensembles1 |
27 Bioclimatic variables |
48 Monthly variables |
|---|---|---|
| RCP4.5 emission scenario2 | 2020s3: |
2020s: |
| RCP8.5 emission scenario | 2020s: |
2020s: |
HadGEM2-ES, CNRM-CM5, CSIRO Mk 3.6, GFDL-CM3, INM-CM4, MRI-CGCM3, MIROC-ESM, CESM1-CAM5, GISS-E2R) that were chosen
to represent all major clusters of similar AOGCMs (Knutti et al 2013), and that had high validation statistics in their CMIP3 equivalents.
2) Average projected global warming increase and likely range for RCP4.5: +1.4°C (±0.5) by the 2050s; +1.8°C (±0.7) by the 2080s; RCP8.5: +2.0°C (±0.6)
by the 2050s; +3.7°C (±0.9) by the 2080s.
3) 2020s: average for years 2011-2040, 2050s: 2041-2070, 2080s: 2071-2100.
AOGCM name, country of origin1 |
Emission scenario2 | 27 Bioclimate variables |
48 Monthly variables |
|---|---|---|---|
| CCSM4, USA | RCP4.5 | 2020s: |
2020s: |
| RCP8.5 | 2020s: |
2020s: |
|
| CNRM-CM5, France | RCP4.5 | 2020s: |
2020s: |
| RCP8.5 | 2020s: |
2020s: |
|
| CanESM2, Canada | RCP4.5 | 2020s: |
2020s: |
| RCP8.5 | 2020s: |
2020s: |
|
| GFDL-CM3, USA | RCP4.5 | 2020s: |
2020s: |
| RCP8.5 | 2020s: |
2020s: |
|
| HadGEM2-ES, UK | RCP4.5 | 2020s: |
2020s: |
| RCP8.5 | 2020s: |
2020s: |
|
| INM-CM4, Russia | RCP4.5 | 2020s: |
2020s: |
| RCP8.5 | 2020s: |
2020s: |
|
| IPSL-CM5A-MR, European Union | RCP4.5 | 2020s: |
2020s: |
| RCP8.5 | 2020s: |
2020s: |
|
| MPI-ESM-LR, Germany | RCP4.5 | 2020s: |
2020s: |
| RCP8.5 | 2020s: |
2020s: |
in their CMIP3 equivalents.
2) Average projected global warming increase and likely range for RCP4.5: +1.4°C (±0.5) by the 2050s; +1.8°C (±0.7) by the 2080s; RCP8.5: +2.0°C (±0.6)
by the 2050s; +3.7°C (±0.9) by the 2080s.
3) 2020s: average for years 2011-2040, 2050s: 2041-2070, 2080s: 2071-2100.
Model selection
Selecting scenarios for climate change impact and adaptation research is a complex task. We selected eight individual models to represent all major clusters of similar AOGCMs (Knutti et al 2013) with high validation statistics in their CMIP3 equivalents. To further whittle the number of AOGCMs under consideration down, researchers often select "worst case", "best case", and "median" climate change projections. However, what constitutes a worst case or best case scenario, differs by region and by the climate variable of interest. The table below may help with scenario selection for states and provinces within western North America. We also provide ensemble scenarios for download above, but they may have unrealistic combinations of individual climate variables.
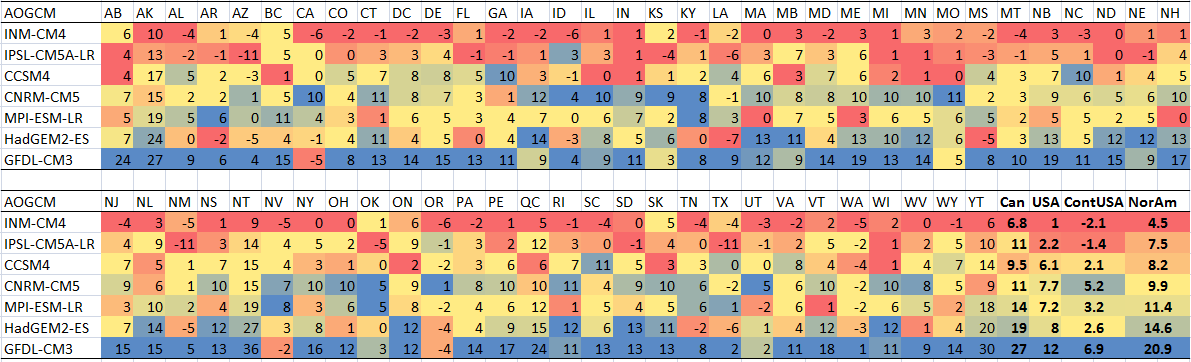
Mean annual temperature change for states and provinces of North America projected for the 2050s under the RCP4.5 scenario. States and provinces are alphabetically sorted from left to right, AOGCMs are sorted by magnitude of projection for North America from top to bottom.
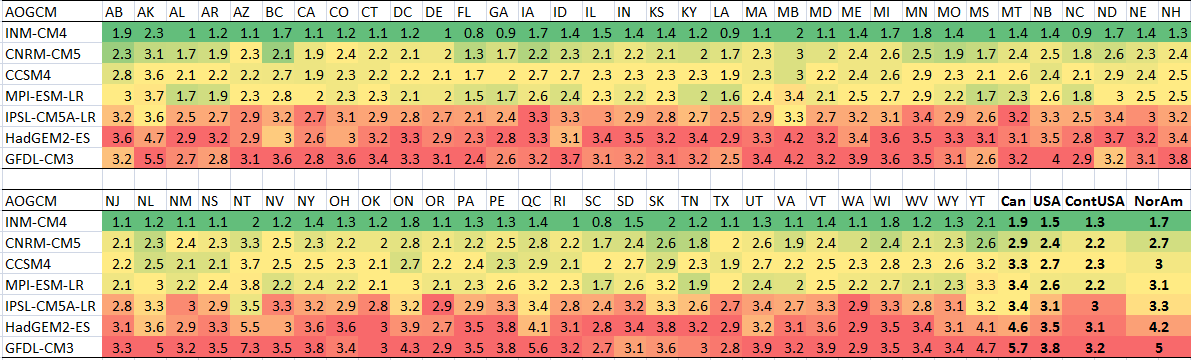
Mean annual precipitation change for states and provinces of North America projected for the 2050s under the RCP4.5 scenario. States and provinces are alphabetically sorted from left to right, AOGCMs are sorted by magnitude of projection for North America from top to bottom.
Previous CMIP3-based climate data (4km resolution)
For a 4km resolution dataset for North America based on the Coupled Model Intercomparison Project phase 3 (CMIP3) database corresponding to the 4th IPCC Assessment Report (2009), follow this link.