|
|
In the simplest use of synthetic schlieren, a translucent screen of evenly spaced thick horizontal black lines is positioned Ls = 15.5 cm behind the tank filled with salt-stratified fluid and the screen is illuminated by fluorescent bulbs, as shown in the Figure. A CCD camera is positioned in front of the tank so that the image of the screen of horizontal lines entirely fills the field of view. The signal from the camera was fed into a computer running the software package DIGIMAGE, which digitizes, enhances and manipulates the images.
Synthetic schlieren works by monitoring how light is deflected as it passes through a stratified medium. If the fluid is strongly stratified, the light is deflected more than if it is weakly stratified. Because internal waves stretch and compress constant density surfaces, they locally change the stratification and, hence, the degree to which light is deflected. Synthetic schlieren thus measures the amplitude of the internal waves by measuring the distortion of the image of horizontal lines.
Synthetic schlieren directly measures changes in the density gradient. from which vertical displacement and velocity fields can be deduced. By determining the value of delta-z, which is the vertical displacement from its initial position of a point on the image of horizontal lines, the corresponding change in the buoyancy frequency, delta-N2, can be determined. A second directly measurable dynamical field is the time derivative of the delta-N2 field, N2t. This is measured by determining the displacement delta-z of the corresponding pixels in two images taken a short time, delta-t, apart during an experiment. The N2t field is found by dividing the delta-N2 field by delta-t. The typical value that we use for delta-t is approximately 0.2 sec which is a small fraction of the wave period.
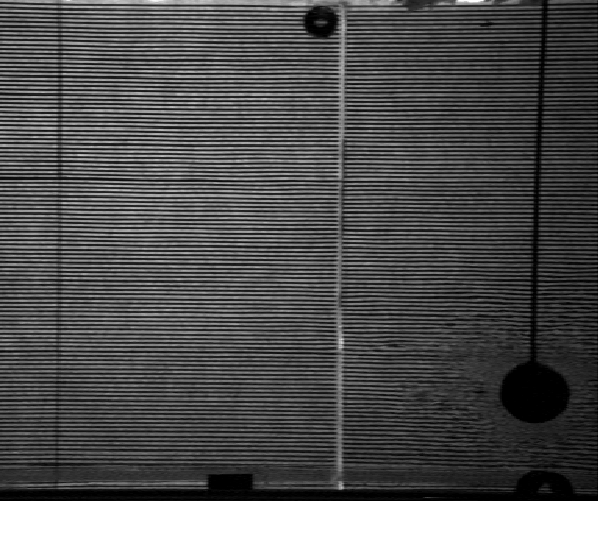
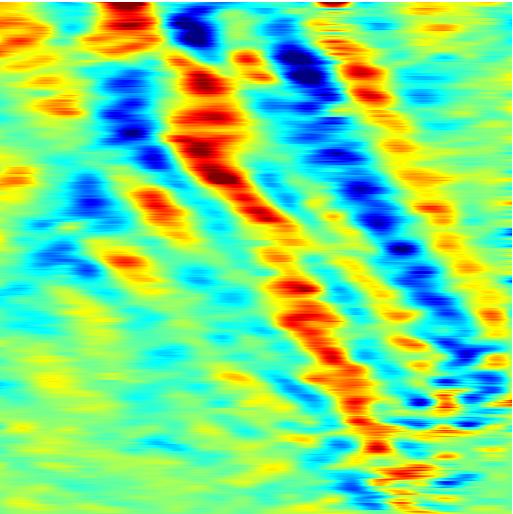
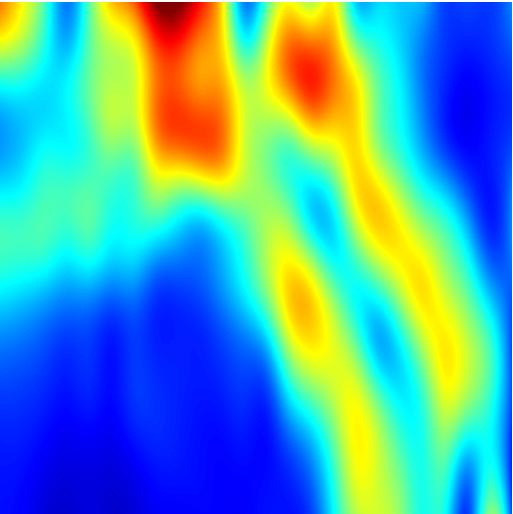
An example of the use of synthetic schlieren is shown in the images below. The unenhanced image taken by the CCD camera is shown in the image on the left. This shows a side veiw of the circular cylinder (of diameter 5.95 cm) with its center approximately 20 cm from the bootm-right corner of the tank. The vertical black line above the cylinder is the thin rod from which the cylinder is suspended. The image of lines behind the tank dominate the field of view. The image is taken during the course of an experiment in which the cylinder has been oscillating for many periods. As predited, internal waves eminate from the cylinder along four beams. Indeed, close to the cylinder, distortions in the background image can be seen with the naked eye. Computer enhancement helps visualize the distortions further from the cylinder and measurements of the N2t field can be made, as shown in the image in the middle. By performing a root-mean-squared and gaussian averaging of the N2t field, its amplitude can be calculated as shown in the image on the right. (Note that the field of view for the calculated N2t and amplitude fields are not the same as that of the raw image on the left. The bottom-right corner of the N2t field is at the center of the cylinder. The field of view is 50 cm by 40 cm).
|
|
|
|
Raw experimental image of the cylinder taken after many oscillations |
N2t field. The red and blue regions represent the crests and troughs of the internal waves respectively |
Amplitude of N2t field. Red regions represent either crests or troughs |
S.B. Dalziel, G.O. Hughes and B.R. Sutherland, Expt. Fluids, 28, 322-325 (2000).
B.R Sutherland, S.B. Dalziel, G.O. Hughes, P.F. Linden, J. Fluid Mech., 390, 93-126 (2000).
Department of Earth and Atmospheric Sciences