J Pharm Pharmaceut Sci (www.ualberta.ca/~csps) 5(3):285-291, 2002
Mathematical modelling of preparation of acyclovir liposomes: reverse phase evaporation method.
Avinash Kumar Seth, Ambikanandan Misra1
Pharmacy Department, Faculty of Engineering & Technology, Maharaja Sayajirao University, Baroda., India.Received 2 September 2002, Revised 31 October 2002, Accepted 8 November 2002
PDF version
Abstract
PURPOSE: The aim of this study was to derive simple reduced second order polynomial equation for constructing contour plots to obtain predetermined % drug entrapment (PDE) within liposomes of acyclovir (ACY) when prepared by reverse phase evaporation (REV) method using technique of three variables at three levels (33) factorial design. METHOD: Three independent variables selected were volume of organic phase (x1), volume of aqueous phase (x2 ), and Drug/Phosphatidylcholine (PC) /Cholesterol (CHOL) in molar ratio (x3 ). Based on factorial design, twenty-seven batches of ACY liposomes were prepared by REV method. Prepared liposomal batches were evaluated for size, lamellarity, and PDE. The PDE (dependent variable) and the transformed values of independent variables were subjected to multiple regressions to establish a second order polynomial equation (full model). To simplify the equation, F-statistic was applied to reduce polynomial equation (reduced model) by neglecting nonsignificant (p>0.05) terms. The coefficient value for independent variable, Drug/PC/CHOL in molar ratio (x3) was found to be maximum (b3 = 2.52) and hence the variable x3 was considered to be a major contributing variable for PDE within liposomes by REV method. The reduced polynomial equation was used to plot three two-dimensional contour plots at a fixed levels of -1, 0 and 1 of major contributing variable (x3) to obtain various combinations of values of two other independent variables (x1 & x2 ) at predetermined PDE. The conformity of the established equation was checked by preparing three batches three times taking values of the independent variables from the contour plots for prefixed value of PDE. RESULTS: Prefixed PDE value taken for designing the experiment and results obtained experimentally were compared using student 't' test and difference between experimentally obtained and theoretically calculated values of PDE was found to be statistically nonsignificant (p>0.05). CONCLUSIONS: Findings of this study establishes the role of the derived equation and plotted contour plots in predicting the values of independent variables for preparation of ACY liposomes by REV method having predetermined PDE.
Introduction
Acyclovir is a drug of choice for the treatment of the infection due to the Herpes simplex or varicella zoster virus. Poor absorption of ACY through GIT and poor distribution to skin necessitates targeting this drug at the site of infection i.e. epidermis and the nerve ganglia. Many liposomal topical deliveries have shown to improve the therapeutic efficiency of the various drugs (1-8) because of deposition of therapeutic levels of drug in skin layers for a prolonged period. Hence, liposomal encapsulation forms drug reservoir onto the skin and reduces side effects due to decrease in rate of systemic drug absorption. Liposomes of ACY are also expected to behave similarly. Thus, preparation of ACY liposomes was an attempt to develop liposomes of ACY with size range from 2mm to 5mm for topical drug delivery (9).
Many methods have been used to prepare liposomes (10). Acyclovir is moderately (1 in 400) soluble in water and insoluble in most of the organic solvents, it is thus reasonable to expect that trapping the drug within aqueous compartment of liposomes (unilamellar) or within large aqueous core area of liposomes (oligolamellar) will be more efficient than trapping this drug in the small layers interstitial water in multilamellar liposomes. Hence, liposomes of ACY were prepared by REV method to obtain maximum PDE. Many independent formulation variables affect the preparation of liposomes using this method. These independent variables are volume of organic to aqueous phase and Drug/PC/CHOL in molar ratio. The ratio of aqueous phase to organic phase is most important variable in REV method for proper emulsification and formation of fine aqueous droplet surrounded by phospholipid, i.e. liposomes, with uniform size, shape, and high PDE.
For economic reasons, it is necessary to optimize these variables for obtaining ACY liposomes with high PDE using minimum PC and optimum CHOL. It is difficult to assess the effect of the variables individually or in combination. Hence, the aim of this investigation was to derive a mathematical model suitable for establishing a quantitative relationship among the variables and predicting the quantitative values of selected independent variables to prepare ACY liposomes having predetermined PDE by REV method.
MATERIALS AND METHODS
Chemicals
Acyclovir, a gift sample from Cadila Pharma, Ahmedabad; Phosphatidylchloine (type-E 80), a gift sample from Lipoid Gmbh, Germany; Cholesterol, purchased from S. D. Fine chemicals, Mumbai; α -tocopherol, purchased from Himedia, Mumbai; and Dialysis sacks [Mol wt. (cut of): 12,000], purchased from Sigma Chemical Co. St Louis, MO. All other chemicals and solvents were of analytical reagent grade.
Preparation of liposomes
Three independent formulation variables were taken at its three levels; low, medium and high, which were represented by the transformed values of -1, 0, and 1 respectively. Values of these selected variables at different levels are shown in table 1.
Table 1: Coded units of 3 3 Factorial design for preparation of ACY liposomes by REV method.
x1- volume of organic phase( Diethyl ether) x2- volume of aqueous phase (Purified water), & x3 -Drug/PC/CHOL (molar ratio).
Twenty-seven batches of liposomes of ACY were prepared by REV method (11) according to experimental design shown in table 2.
Table 2: Experimental design and % drug entrapment (PDE).
# Geometric mean diameter
§ Geometric standard deviation
PC, CHOL, and a -tocopherol (1% of PC by weight) were dissolved in diethyl ether (organic phase) in a glass boiling tube [Quick fit neck B-24]. 9 mmol/ml of drug solution in purified water was injected rapidly into lipid solution through 23-gauge hypodermic needle from a 5 ml syringe. The tube was closed with glass stopper and sonicated for 5 minutes in a bath sonicator (Model V33, frequency-22 KHz, 120W, Vibronics Pvt. Ltd, Mumbai, India.). It was then attached directly to a rotary evaporator to dry the contents at 37°C under vacuum (250 mm of Hg) until a gel was formed. Vacuum was released and the tube was removed from the evaporator and subjected to vigorous mechanical agitation on vortex mixer for 5 minutes. When the gel collapsed to fluid, it was again fitted to rotary flash evaporator for the removal of organic solvent. A cycle of 10 minutes drying and 5 minutes vortexing was again repeated twice. Final liposomal suspension was subjected to complete removal of last traces of organic solvent in a rotary flash evaporator under vacuum (600 mm of Hg) for 15 minutes. Each batch was prepared three times and stored in refrigerator. The prepared liposome batches were evaluated for PDE, size, and lamellarity.
Characterization of liposomes
Estimation of entrapped drug and other components
ACY within liposomes was estimated after removing unentrapped ACY by the method of dialysis (12). The dialysis was carried out by taking liposomal suspension in dialysis sack (donor compartment), which was dipped in a beaker containing 200 ml of purified water (receiver compartment) and magnetic needle. The beaker was kept on a magnetic stirrer adjusting magnetic needle's rotation to 100-120 rpm and run for 4 hours. After 4 hours, the solution of receptor compartment was estimated for unentrapped ACY at 250 nm using Hitachi U-2000 Spectrophotometer. The PDE in the liposomes was calculated from the difference between the initial drug added and the drug detected in the receptor compartment of the dialysis unit. PC was quantified by ion-pair complexing according to earlier described method (13) and CHOL was quantified by complexing it with acetic acid and ferric chloride, as described by Zlatkis (14). The data of recovered PC and CHOL are not shown. The mean PDE of all the batches is recorded in the table 2.
Photomicrography
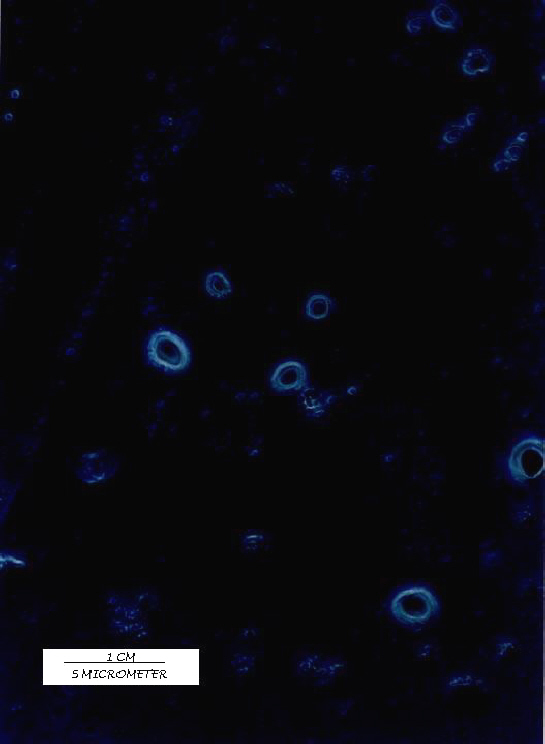
All the batches of the liposomes prepared were observed under Olympus (BX 40F4, Tokyo, Japan) microscope with a polarizing attachment to study their size and lamellarity. A Photomicrograph under 1000x magnification is shown in figure 1.
Figure 1: Acyclovir liposomes prepared by REV method.
Determination of geometric mean diameter of liposomes
Samples of ACY liposomes were evaluated for particle size after suitable dilution by optical microscopy using Olympus (BX 40F4, Japan) microscope under 1000x magnification (15). Linear diameters of 200 liposomes were measured for every sample. Mean geometric diameters (dg ) and geometric standard deviation (sg) were calculated by plotting logarithms of size of liposomes against the cumulative % frequency undersize on a probability scale. Results are shown in table 2.
Data processing
A technique of 33 factorial design (16) taking three prime selected formulation variables at their three different levels, affecting the eminence of liposomes was used to design the experimental batches for the preparation of ACY liposomes by REV method. Prime independent formulation variables affecting the PDE in REV method were volume of organic phase (x1), volume of aqueous phase (x2) and Drug/PC/CHOL in molar ratio (x3).
Twenty-seven batches of different combinations were prepared by taking values of selected variables; x1, x2 and x3 at different levels as shown in table 2. The prepared batches were evaluated for PDE; a dependent variable, size and lamellarity. The results are recorded in table 2. Mathematical modeling of the preparation of ACY liposomes by REV method was carried out by using equation 1 to obtain a second order polynomial equation (17).
Where Y is the dependent variable (PDE) while bi , bij and bijk represent the regression coefficients for second order polynomial and xi represents the levels of the independent formulation variables i.e., volume of organic phase (x1), volume of aqueous phase (x2), and Drug/PC/CHOL in molar ratio (x3). A full model (equation 2) is established after putting the values of regression coefficients in equation 1.
Neglecting nonsignificant (p > 0.05) terms from the full model establishes a reduced model (equation 3), which facilitates the optimization technique by plotting contour plots keeping one major contributing independent formulation variable constant and varying other two independent formulation variables, to establish the relationship between independent and dependent formulation variables.
Multiple regression
Transformed values of independent variables; volume of organic phase (x1), volume of aqueous phase (x2) and Drug/PC/CHOL in molar ratio (x3) and its products as in equation 1 along with the PDE values (dependent variable) were subjected to multiple regression to determine the coefficients (bo, bi, bij, bijk ) and the p-values of each term of the equation. A second order polynomial equation was derived by substituting the values of bo, bi, bij, and bijk in equation 1. This equation represents a full model (equation 2). The terms of full model having p values nonsignificant (p>0.05) have negligible contribution in obtaining dependent variable and thus neglected. Neglecting noncontributing terms of equation 2, a reduced polynomial equation obtained is equation 3. Results of ANOVA of full model and reduced model was carried out and then F-statistic (18) was applied to check whether the nonsignificant terms can be omitted or not from the full model (table 3).
Table 3: Results of ANOVA of full and reduced models.
A: Full model, (B): Reduced model,
ND = Number of beta parameters being tested = 4 (those having p>0.05),
F calculated = [(SSE1-SSE2)/ND/ (SSE2/df Residual) = 7.05/3.3 = 2.14
The coefficient value of variable, Drug/PC/CHOL in molar ratio (x3) in reduced model (equation 3) was found to be highest and expected to be major contributing in the preparation of ACY liposomes by REV method. Hence, it was fixed at -1, 0, and 1 level varying other two independent variables for establishing contour plots.
Construction of Contour plots
Two-dimensional contour plots were established using reduced polynomial equation (equation 3). Values of x1 and x2 were computed at prefixed values of PDE and three contour plots were established between x1 and x2 at fixed level of -1, 0, and 1 of x3 as shown in figure 2 (a, b, and c).
Figue 2: Contour plots (a) at -1 level of variable x3, (b) at 0 level of variable x3 and (c) at 1 level of variable x3.
Checkpoint
A check point experiment was performed to confirm the utility of established contour plots and reduced polynomial equation (equation 3) in the preparation of ACY liposomes by REV method. Values of independent variables (x1 and x2) were taken from three check points each on contour plots plotted at fixed level of -1, 0, and 1 of x3 and the values of PDE (dependent variable) was calculated by substituting the values in the reduced polynomial equation. Liposomes of ACY were prepared experimentally by taking the amounts of the independent variables (x1 and x2) on the same checkpoints. Each batch was prepared three times and mean PDE values were determined (table 4).
Table 4: Checkpoint table.
*n = 3, **Difference from calculated PDE value nonsignificant (P>0.05).
x3- Drug/PC/CHOL (molar ratios), x1- Volume of organic phase, x2- Volume of aqueous phase. α-Calculated PDE. β-Experimentally obtained PDE (±SEM)
Difference of theoretically computed values of PDE and mean values of experimentally obtained PDE was compared by using student 't' test method.
Results and discussion
Twenty-seven batches of ACY liposomes were prepared by REV method by using 33 factorial design (table 1) varying three independent variables volume of organic phase (x1), volume of aqueous phase (x2) & Drug/PC/CHOL in molar ratio (x3). The PDE (dependent variable) of prepared batches was determined and the results are recorded in table 2. Prepared liposomes were also observed under 1000x magnification using Olympus (BX 40 F4, Japan) microscope to examine their size and lamellarity. The liposomes were found to be oligolamellar with large aqueous core. The mean geometric diameter of oligolamellar type vesicles varies from 3.2 to 5.0 mm with geometric standard deviation (sg ) from 1.5 to 2.3 as shown in table 2. A substantial high drug entrapment achieved in liposomes prepared by REV method was 71.1% at -1 level of x3 (1:2:0.5), 0 level of x1 (6 ml) and -1 level of x2 (1 ml).
The PDE (dependant variable) obtained at various levels of three independent variables (x1 , x2 and x3) were subjected to multiple regression. A second order polynomial equation 2 (full model) was obtained.
The main effects of x1, x2 and x3 represent the average result of changing one variable at a time from its low to high value. The interactions (x1 x2, x1 x3, x2 x3 and x1 x2 x3 ) show how the PDE changes when two or more variables were simultaneously changed. The PDE values for the 27 batches showed a wide variation starting from a minimum of 35.6% to maximum of 77.2% (table 2). This is reflected by the wide range of coefficients of the terms of equation 2 representing the effect of individual and combined variables. Small values of coefficients of terms x22, x32, x2 x3, and x1 x2 x3 (having p>0.05) in equation 2 are regarded as least contributing in the preparation of ACY liposomes by REV method. Hence, these terms are neglected from full model (equation 2) considering nonsignificant (15) and a reduced polynomial equation (equation 3) obtained following multiple regression of PDE and significant terms (p<0.05) of equation 2.
F-statistic (17) of the results of ANOVA of full model and reduced model confirmed omission of nonsignificant terms of equation 2. Since the calculated F-value (2.14) is less than the tabled F-value (3.01) ( a = 0.05, v1 = 4 and v2 = 16), it was concluded that the neglected terms do not significantly contributing in predicting of PDE. When the coefficient values of three independent key variables (x1, x2, & x3) in equation 3 were compared, the value for variable x3 (b3 = 2.52) was found to be maximum and hence the variable x3 was considered to be a major contributing variable for PDE of ACY liposomes by REV method.
The reduced model (equation 3) was used to plot three two-dimensional contour plots (figures 2a, 2b, and 2c) at fixed levels of -1, 0, and 1 of major contributing variable (x3) respectively and computing the values of x1 and x2 between -1 to 1 at prefixed value of PDE.
Contours
Figure 2a shows the possible contour plots drawn at -1 level of x3 for prefixed PDE values of 50%, 60%, 65% and 70%. Up to 65% PDE values, the plots were found linear but for 70% PDE, the plot was found to be nonlinear having upward and downward segments signifying nonlinear relationship between x1 and x2 variables. It was elucidated from the nonlinear contour that maximum PDE (70%) could be obtained with x1 range at -0.332 level (5.00 ml) to 0.300 level (6.9 ml) and x2 at -1 level (1.0 ml) for both levels of x1. Thus, the two points of this contour on the base line signifies that aqueous to organic phase ratio could range from 1:5.0 to 1:6.9. But, the apex of this nonlinear contour suggests that maximum aqueous phase (x2) can be increased from -1 level (1.0 ml) to 0.285 level (1.6 ml). At apex of this contour plot, the organic phase (x1) resides at 0.1 level (6.3 ml), resulting in aqueous to organic phase ratio of 1:3.84. Thus, a wide range of aqueous to organic phase ratio was computed for obtaining maximum PDE (70%) at a fixed -1 level of x3 variable by selecting values of organic phase (x1) and aqueous phase (x2). It was concluded from this contour plot that the emulsification of aqueous and organic phase at -1 level of x3 could successfully be carried out within these range of aqueous to organic phase i.e. (from 1:3.84 to 1:6.9) for obtaining maximum PDE (70%). The formulator can use the best ratio with respect to cost of the materials.
Figure 2b shows the possible contour plots plotted at 0 level of x3 for prefixed PDE values of 50%, 60%, 65% and 70%. All contour plots were found to be linear in nature. The maximum PDE (70%) can be computed with x1 range at 0.148 level (6.44 ml) to 0.326 level (6.98 ml) and the x2 range at -1 level (1.0 ml) to 1 level (2.0 ml). Thus, the range of aqueous to organic phase ratio for better emulsification at 0 level of x3 was computed in the range of 1:3.22 to 1:6.98 for obtaining maximum PDE.
Similarly, figure 2c shows the possible contour plots plotted at 1 level of x3 for prefixed PDE values of 50%, 60%, 65% and 70%. All contour plots were found to be linear in nature. The maximum PDE (70%) can be computed with x1 range at 0.212 level (6.64 ml) to 0.340 level (7.02 ml) and x2 range at -1 level (1.0 ml) to 1 level (2.0 ml). Thus, the range of aqueous to organic phase ratio for better emulsification at 1 level of x3 was computed in the range of 1:3.32 to 1:7.02 for obtaining maximum PDE.
Thus, the results of contour plots revealed the range of aqueous to organic phase ratio in REV method for the preparation of ACY liposomes from 1:3 to 1:7 at all levels of x3 i.e., Drug/PC/CHOL (molar ratio). Findings of this investigation confirm the earlier results (10), which claimed 1:3 as the ratio of aqueous to organic phase when diethyl ether was taken as organic phase. Conversely, it is evident from the results that plotted contours can be used in predicting the range of ratio of aqueous phase to organic phase in a precise manner.
Checkpoint experiment
Three check points were selected each on three plotted contours at fixed levels of -1, 0, and 1 of x3 (table 4). The computed PDE values from contours at -1, 0, and 1 level were found to be 69.9, 69.9, and 70.0 respectively. Liposomes at these three checkpoints were prepared experimentally by REV method using the amounts of x1 and x2 at the selected checkpoints. The experiment was repeated three times and the experimentally obtained mean PDE values were 69.6( ± 0.882), 69.3( ± 1.050), and 69.7( ± 1.691) corresponding to its theoretically computed values. When experimentally obtained and theoretically computed PDE values were compared using student `t' test, the difference was found nonsignificant (p>0.05). This confirms the role of a derived reduced polynomial equation and contour plots in the preparation of ACY liposomes of predetermined PDE by REV method.
Conclusion
Findings of these studies conclusively demonstrate the use of 33 factorial design, derived reduced polynomial equation, and two-dimensional contour plots in preparation of liposomes of ACY by REV method. Finally, contour plots may be used for preparing liposomes with predetermined PDE with reduced number of experiments; thereby may help in reducing the cost of development of liposomes with desired PDE. Similar methodology may also be used in optimizing process variables.
Acknowledgements
All India council of Technical Education, New Delhi, funded this study.
References
Massimo, F. and Giovanni, P., Corticosteroid dermal delivery with skin-Lipid liposomes. J Control rel, 44:141-151, 1997.
Mezei, M. and Gulasekharam, V., Liposomes: a selective drug delivery system for topical route of administration: I. Lotion dosage form. Life Sci, 26:1473-1477, 1980.
Mezei, M. and Gulasekharam, V., Liposomes: a selective drug delivery system for topical route of administration: gel dosage form. J Pharm Pharmacol, 34:473-474, 1982.
Lasch, J. and Wohlrab, W., Liposome-bound cortisol: a new approach to cutaneous therapy. Biomed Biochim Acta, 10:1295-1299, 1986.
Wohlrab, W. and Lasch, J., Penetration kinetics of liposomal hydrocortisone in human skin. Dermatologica, 174:18-22, 1987.
Korting, H. C., Zienicki, H., Schafer-Korting, M. and BraunFalco, O., Liposome encapsulation improves efficacy of betamethasone dipropionate in atopic eczema but not in psoriasis vulgaris. Eur J Cli Pharmacol, 39:349-351, 1990.
Skako, N., Cajokav, M. and Jalsenjak, I., Liposomes with clindamycin hydrochloride in therapy of acne vulgaris. Int J Pharm, 85:97-101, 1992.
Patel, V.B., Misra, A. N. and Marfatia Y. S., Preparation and comparative clinical evaluation of liposomal gel of benzoyl peroxide for acne. Drug Devel Ind Pharm, 27(8):863-869, 2001.
Sharma, B.B., Jain, S.K. and Vyas, S.P., Topical liposome system bearing local anesthetic lignocaine: preparation and evaluation. J microencap, 11(3): 279-286, 1994.
Knight C. G., Liposomes: From physical structure to therapeutic application, New York, Elsevier/North-Holland Biomedical Press, 1981.
Szoka, F. and Papahadjopoulos, D., Procedure for preparation of liposomes with large internal aqueous space and high capture by reverse evaporation. Proceedings of the National Academy of Sciences, USA, 75:4194-4198, 1978.
New, R. R.C., Liposomes: a practical approach. New York: Oxford University Press, 1990.
Stewart, M. and Charles J., Colorimetric determination of phospholipids with ammonium ferrothiocynate. Anal Biochim, 104:10-14, 1980.
Zlatkis, A., Zak, B. and Boyle, A., A new method for the direct determination of serum cholesterol. J Lab Clin Med, 41: 486-492, 1953.
Martin, A. N., Swarbrick, J. and Cammarata, A., Physical Pharmacy, 2nd Edn. Philadelphia: Lea & Febiger, 1969.
Bolton S., Pharmaceutical Statistics: Practical and Clinical Applications 3rd Edn., New York: Marcel Dekker INC., 1997.
Anthony Armstrong, N. and James, K.C., Pharmaceutical Experimental Design and Interpretation. Bristol PA USA: Taylor and Francis Publishers, 1996.
Mendenhall, W. and Sincich, T., A second course in business statistics:Regression analysis. In: Multiple Regression. CA:Dellen Publishing, p.p. 141-226, 1989.
Corresponding Author: Ambikanandan Misra, Pharmacy Department, Faculty of Engineering and Technology, M.S. University, Baroda, India. misraan@hotmail.com; misraan@satyam.net.in
Published by the Canadian Society for Pharmaceutical Sciences.
Copyright © 1998 by the Canadian Society for Pharmaceutical Sciences.
http://www.ualberta.ca/~csps

.gif)
.gif)
.gif)