J Pharm Pharmaceut Sci (www.ualberta.ca/~csps) 5(3):272-278, 2002
Response surface optimization of the critical medium components for the production of alkaline protease by a newly isolated Bacillus sp.
K. Adinarayana1, P. Ellaiah
Pharmaceutical Biotechnology Division, Department of Pharmaceutical Sciences, Andhra University, Visakhapatnam, India.Received 8 June 2002, Revised 24 September, Accepted 9 October 2002
PDF version
Abstract
PURPOSE: Optimization of the fermentation medium for maximum alkaline protease production was carried out using a new strain, Bacillus Sp. PE-11. METHODS: The carbon source (glucose), the nitrogen source (peptone) and salt solution were selected to optimize. A 23 full factorial composite experimental design and response surface methodology were used in the design of experiments and in the analysis of results. This procedure limited the number of actual experiments performed while allowing for possible interactions between the three components. RESULTS AND DISCUSSION: The optimum values for the tested variables for the maximum alkaline protease production were; glucose 7.798 (g/L), peptone 9.548 (g/L) and salt solution 8.757%. The maximum alkaline protease production was 4,98,123 PU/L. This method was efficient; only 20 experiments were necessary to assess these conditions, and model adequacy was very satisfactory, as the coefficient of determination was 0.941. CONCLUSIONS: In the work, we have demonstrated the use of a central composite factorial design by determining the conditions leading to the high yield of enzyme production. Thus, smaller and less time consuming experimental designs could generally suffice for the optimization of many fermentation processes.
Introduction
Proteases constitute one of the most important groups of industrial enzymes and have applications in different industries viz., detergent, food, pharmaceutical, leather, silk and for recovery of silver from used x-ray films (1-5). These proteases account for 30% of the total worldwide enzyme production (6).
Pepsin was used in laundry detergents as early as 1913, but is now being replaced by a mixture of serine and metal microbial proteases that appear to be less degradable by soaps, alkaline conditions and high temperatures (7).
Alkaline proteases are produced by a wide range of microorganisms including bacteria, moulds, yeasts and also mammalian tissues. Among bacteria, Bacillus Sp. are specific producers of extracellular proteases (8-10). These are used as cleansing additives in detergents to facilitate the release of proteinacious materials in stains due to grime, blood, milk, etc. Bacillus Sp. grows in a pH range of 7.0 -11.0 and produces extracellular alkaline proteases (8-10).
Alkaline proteases are generally produced by submerged fermentation. In addition, solid state fermentation processes have been exploited to a lesser extent for production of these enzymes (11-13). In commercial practice, the optimization of medium composition is done to maintain a balance between the various medium components, thus minimizing the amount of unutilized components at the end of fermentation. Research efforts have been directed mainly towards evaluating the effect of various carbon and nitrogen nutrient cost-effective substrates on the yield of enzymes, requirement of divalent metal ions in the fermentation medium and optimization of environmental and fermentation parameters such as pH, temperature, aeration, and agitation. In addition, no defined medium has been established for the optimum production of alkaline protease from different microbial sources. Each organism or strain has its own special conditions for maximum enzyme production. In our preliminary studies in the development of the production medium, glucose and peptone were found to be important factors in enhancing the alkaline protease formation. However, no systematic study to achieve optimum medium composition and process conditions has been reported for the production of alkaline proteases.
The conventional method of optimization involves varying one parameter at a time and keeping the others constant. This often does not bring about the effect of interaction of various parameters as compared to factorial design (14). Response surface methodology (RSM) is a useful model for studying the effect of several factors influencing the responses by varying them simultaneously and carrying out a limited number of experiments.
The present investigation is aimed at optimization of medium components (glucose, peptone and salt solution), which have been predicted to play a very significant role in enhancing the production of alkaline protease. Hence the use of experimental factorial design (15) and response surface methodology (16-17), already successfully applied in other fields, is well suited to the study of the main and interaction effects of the factors on the production of alkaline protease. Thus a 2 3-1 full factorial central composite design and response surface methodology (18-24) was used in this study. Optimization of medium by the classical method involves changing one independent variable (glucose, peptone or salt solution) while maintaining all others at a fixed level is extremely time consuming and expensive when a large number of variables are evaluated. To overcome this difficulty, experimental factorial design and response surface methodology can be employed to optimize the medium components.
MATERIALS AND METHODS
Micro-organism
A new strain of Bacillus sp. PE-11 (25), isolated in our laboratory, was used as the producer of alkaline protease enzyme. It was grown at 37°C for 24 h and maintained on nutrient agar slants at 4°C and was subcultured at four week intervals.
Inoculum preparation
Inoculum was prepared by transferring 5ml suspension prepared from a 24 h old slant culture, into 250 ml Erlenmeyer flask containing 45 ml of sterile inoculum medium. The composition of the inoculum medium consisted of glucose 2.0 g/L, casein 0.5 g/L, peptone 0.5 g/L, yeast extract 0.5 g/L and salt solution 50 mL (salt solution containing KH2 PO4 5 g/L, MgSO4.7H2O g/L and FeSO4 .7 H2O, 0.1 g/L). The flask was kept on a rotary shaker at 220 rpm at 37°C. A 10 mL aliquot per 100mL production medium served as its inoculum.
Shake flask experiments
Five milliliters of 24 hour aged inoculum (10 8 cells/mL) of Bacillus PE-11 was added to 45 mL production medium in 250 mL Erlenmeyer flasks. The composition of production medium comprising: glucose 5.0 g/L, peptone 5.0 g/L and salt solution 50 ml (salt solution containing KH 2 PO 4 5 g/L, MgSO4.7H 2 O 2 g/L and FeSO 4 .7 H 2 O, 0.1 g/L). The range and levels of test variables are given in Table 1.
Table 1: Boundaries of experimental domain and spacing of levels expressed in coded and natural units.
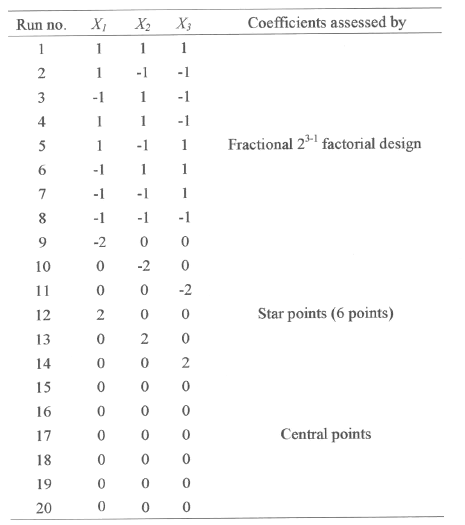
The concentrations of glucose, peptone and salt solution in the production medium were varied according to the experimental design shown in the Table 2.
Table 2: Central composite design consisting of 20 experiments for the study of 5 experimental factors in coded units.
The pH value of the medium was adjusted before sterilization by adding 1N NaOH or 1N HCl. Five milliliter quantities of samples were withdrawn from each flask after 48 hours of fermentation and centrifuged at 2000 rpm for 10 min. The clear supernatant broth was used to determine the enzyme yield. All the experiments were carried out in triplicate and average values were reported.
Analytical methods
Alkaline protease activity was determined by a modified procedure based on the method of Tsuchida et. al (26). One protease unit (PU) is defined as the amount of enzyme that releases 1 mg of tyrosine per mL per min under the above assay conditions. All experiments were conducted in triplicate and the mean of the three is presented.
Experimental design and optimization by RSM
Response surface methodology (RSM) consists of a group of empirical techniques devoted to the evaluation of relations existing between a cluster of controlled experimental factors and the measured responses, according to one or more selected criteria. A prior knowledge and understanding of the process and the process variables under investigation are necessary for achieving a more realistic model. Based on the results obtained in preliminary experiments, glucose, peptone and salt solution were found to be major variables in the protease production. Hence, these variables were selected to find the optimized conditions for higher protease production using central composite design and response surface methodology.
The range and the levels of the experimental variables investigated in this study are given in the Table 1. The central values (zero level) chosen for experiment design were glucose 6 g/L, peptone 6 g/L and salt solution 75 mL/L. In developing the regression equation the test factors were coded according to the equation.
Where x i is the coded value of the i th independent variable, X i is the natural value of the ith independent variable, Xxi is the natural value of the ith independent variable at the center point and D X i is the step change value.
Where Y is the measured response, bo , intercept term, bi,ij , and bii are, respectively the measures of the effects of variables Xi , Xi Xj , and Xi2. The variable Xi Xj represents the first- order interactions between Xi and Xj (i<j).
Several experimental designs have been considered to study such model, and we selected the central composite design proposed by Box et al (18). For this study, 23-1 fractional factorial design with six star points and six replicates at the centre points were employed to fit the second order polynomial model which indicated that 20 experiments were required for this procedure. The `statistica' software was used for regression and graphical analysis of the data obtained. The optimum values of the selected variables were obtained by solving the regression equation and also by analyzing the response surface contour plots (24).
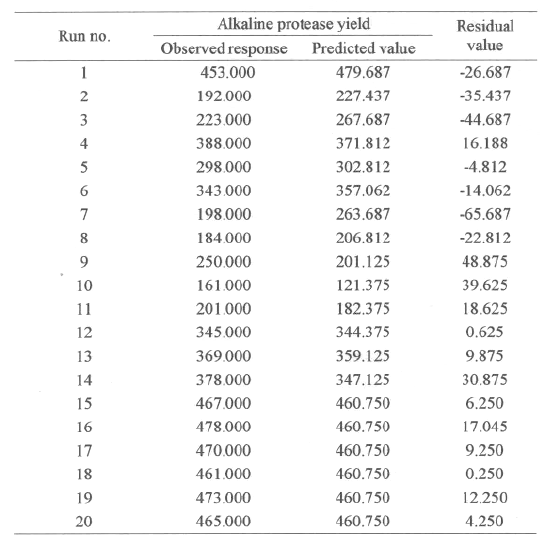
In all, the 20 fermentation experiments were conducted in triplicate, and the average values of alkaline protease yields were tabulated, as given Table 3, under column, observed response.
Table 3: Observed responses and predicted values.
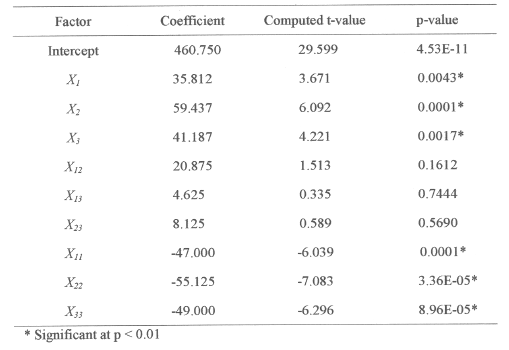
The predicted values were calculated by using the mathematical model derived from the coefficients of the model shown in Table 4, and the predicted values are tabulated in Table 3.
Table 4: Model coefficients estimated by multiples linear regression.
RESULTS AND DISCUSSIONS
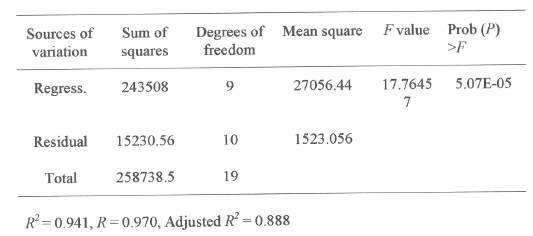
The results of the second order response surface model fitting in the form of analysis of variable (ANOVA) are given in Table 5.
Table 5: Analysis of variance (ANOVA) for the five factorial design
The fisher F-test with a very low probability value (Pmodel > F = 5.07E-05) demonstrate a very high significance for the regression model (19, 24). The goodness of fit of the model was checked by the determination coefficient (R2). In this case, the value of the determination coefficient (R2 = 0.941) indicates that only 5.90% of the total variations are not explained by the model. The value of the adjusted determination coefficient (Adj. R2 = 0.888) is also very high, which indicates a high significance of the model (19,24). A higher value of the correlation coefficient (R = 0.970) signifies an excellent correlation between the independent variables (18). At the same time a relatively lower value of the coefficient of variation (CV= 11.20) indicates improved precision and reliability of the conducted experiments (19,23).
The application of response surface methodology (22-24) yielded the following regression equation which is an empirical relationship between the logarithmic values of enzyme yields and test variables in coded unit:
Where Y is the response, that is, the enzyme concentrations expressed in logarithmic values, and x1, x2 and x3 are the coded values of the test variables (glucose, peptone and salt solution respectively).
The significance of each coefficient was determined by student's t-test and p values, which are listed in Table 4. The larger the magnitude of the t- value and the smaller the p- value, the more significant is the corresponding coefficient (19,24). This implies that the quadratic main effects of glucose, peptone and salt solution are more significant than their respective first order effects. The second order main effects of both peptone and salt solution are significant, as is evident from their respective P-values (P x1 2 < 0.0001, P x2 2 < 3.36E-05 and P x3 2 < 8.96E-05) with their first order main effects (P x1 < 0.0043, P x2 < 0.0001 and P x3 < 0.0017). These values suggest that the concentration of glucose and peptone have a direct relationship on the production of the enzyme. In Table 3 each of the observed values for Y f (0) is compared with the predicted values, Y f (P), from the model. The comparison of the residuals showed an error variance Se 2 (=0.022), which indicates that none of the individual residual values exceed twice the square root of the residual variances (19). All of the above considerations indicate an excellent adequacy of the regression model (18-24).
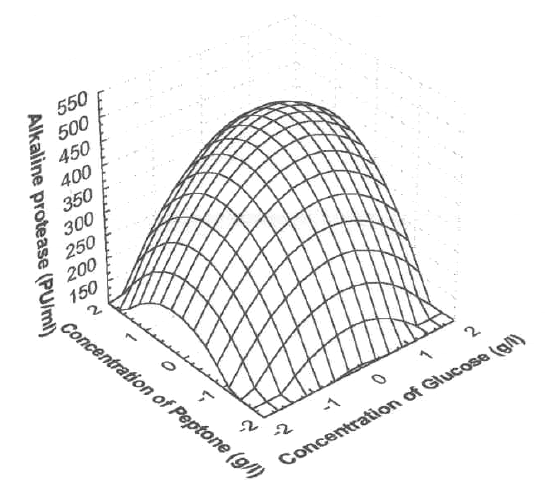
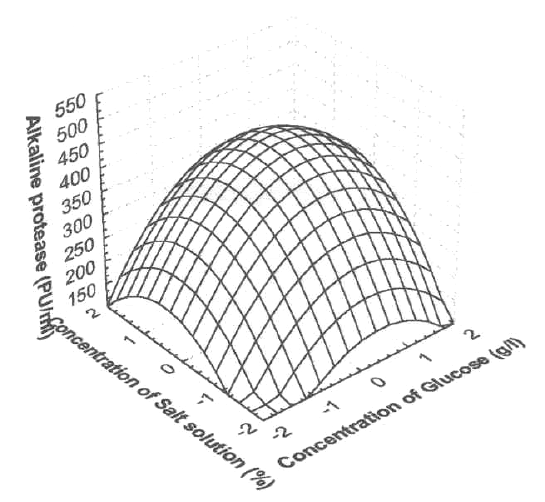
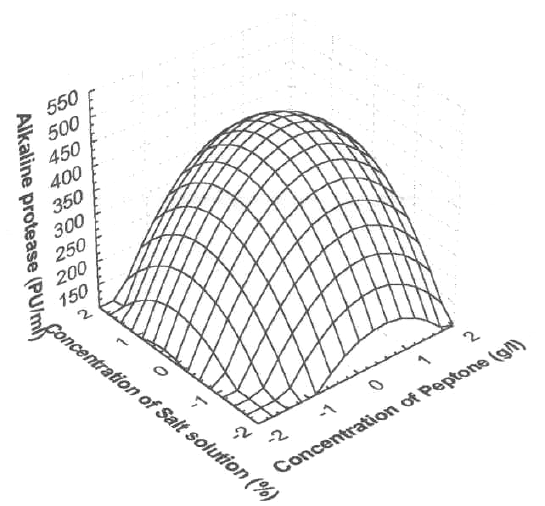
Response surface plots as a function of two factors at a time, maintaining all other factors at fixed levels (zero, for instance), are more helpful in understanding both the main and the interaction effects of these two factors. These plots can be easily obtained by calculating from the model the values taken by one factor where the second varies (from -2.0 to +2.0, step 0.5 for instance) with constraint of a given Y value. The yield values for different concentrations of the variables can also be predicated from the respective response surface plots (Figure 1-3). The maximum predicted yield is indicated by the surface confined in the response surface diagram.
Figure 1 shows the response surface plot obtained as a function of glucose concentration vs. peptone concentration, while all other variables are maintained at zero level. An increase in alkaline protease yield with increase in glucose concentration, versus peptone concentration was observed.
Figure 1: Response surface plot showing the effect on glucose concentration, peptone concentration and their mutual effect on the production of alkaline protease. Other variables are held at zero level.
Figure 2 shows the response surface plot obtained as a function of glucose concentration vs. salt solution concentration, while other variables are maintained at zero level. An increased alkaline protease yield with increase in glucose concentration vs. salt solution concentration was observed.
Figure 2: Response surface plot showing the effect on glucose concentration, salt solution concentration and their mutual effect on the production of alkaline protease. Other variables are held at zero level.
Figure 3 shows the effect of peptone concentration vs. the salt solution concentration, while other variables are maintained at zero level. An increase in alkaline protease yield with increased peptone concentration vs. salt solution concentration was observed.
Figure 3: Response surface plot showing the effect on peptone concentration, salt solution concentration and their mutual effect on the production of alkaline protease. Other variables are held at zero level.
The alkaline protease production is predominantly influenced by glucose and peptone concentrations. Glucose and peptone are therefore the key nutrient materials which control the biosynthesis of the enzyme. At higher concentrations both nutrients may cause inhibition of enzyme synthesis. This fact was also suggested during other enzyme production experiments on carbon and nitrogen repression effects (27-30).
The multi-stage Monte-Carlo optimization method (31) was used to solve the regression equation (eqn. 2). The optimal values of the test variables in coded units are as follows; x1 = 0.557, x2 = 0.682 and x3 = 0.503 with the corresponding Y= 501.345. The natural values obtained by substituting the respective values of x1 in equation (1) are: glucose 7.798 g/L, peptone, 9.548 g/L, salt solution 8.757%. The modeled values predict that the maximum concentration of enzyme that can be obtained by using the above optimized concentrations of the variables is 5,01,345 PU/L. Verification of the predicted results were accomplished by using the optimized conditions in incubation experiments. An increase in enzyme production of about 4,98,123 PU/L was observed. This results therefore corroborate the predicted values, and the effectiveness of the model.
CONCLUSIONS
This work has demonstrated the use of a central composite factorial design by determining the conditions leading to the optimum yield of enzyme production. This methodology could therefore be successfully employed to any process, where an analysis of the effects and interactions of many experimental factors are required. Central composite experimental design maximizes the amount of information that can be obtained, while limiting the numbers of individual experiments required. Isoresponse curves are very helpful in visualizing the main effects and interaction of the factors. Thus, smaller and less time consuming experimental designs could generally suffice for the optimization of many fermentation processes.
ACKNOWLEDGEMENTS
Mr. K. Adinarayana is thankful to Andhra University, Visakhapatnam, India, for providing the infrastructure facilities for this study.
Masse, F.W.J.L. and Tilburg, R.V., The benefit of detergent enzymes under changing washing conditions. J. Am. Oil Chem. Soc., 60:1672-1675, 1983.
Anisworth, S.J., Soap and detergents. Chem. Eng. News, 72:34-59, 1994.
Outtrup, H., Dambmann, C., Christiansen, M., and Aaslyng, D.A. Bacillus Sp.JP 395, method of making and detergent composition. Us Patent Number, 5466594, 1995.
Wolff, A.M., Showell, M.S., Venegas, M.G., Barnett, B.L., and Wertz, W.C. Laundry performance of subtilisin proteases, Bolt R, Betzel C (eds), Subtilisin enzymes: practical protein engineering. New York: Plenum Press, pp.113-120, 1993.
Inhs, D.A., Schmidt, W., and Richter, F.R., Proteolytic enzyme cleaner, Us Patent Number , 5961366, 1999.
Horikoshi, K. Alkalophiles – from an industrial point of view. Fems Microbiol. Rev., 18:259-270, 1996.
Bailey, J.E., and Ollis, D.F. Isolation and utilization of enzyme., Clark BJ, Tokay B, Bradley JW (eds). Biochemical engineering fundamentals. New York: McGraw Hill Inc, pp. 196, 1977.
Markland, F.S., Smith, E.L. Subtilisin: primary structure, chemical and physical properties. Boyer P.D (ed). The enzymes, 3rd. New York: Academic Press, pp. 561-608, 1971.
Priest, F.G. Extracellular enzyme synthesis in the genus Bacillus. Bacteriol. Rev., 41:711-753, 1977.
Godfrey, T.A., Reichelt, J. Industrial enzymology: The application of enzymes in industry. London: The Nature Press, 1985.
Chakraborty, R. and Srinivasan, M. Production of a thermostable alkaline protease by a new pseudomonas sp. by solid state fermentation. J. Microb. Biotechnol., 8:1-16, 1993.
Malathi, S. and Chakraborty, R. Production of alkaline protease by a new Aspergillus flavus isolate under solid state fermentation conditions for use as a depilation agent. Appl. Environ. Microbiol., 57:712-716, 1991.
George, S., Raju, V., Krishnan, M.R.V., Subramanian, T.V. and Jayaraman, K., Production of protease by Bacillus amyloliquefaciens in solid state fermentation and its application in the unhairing of hides and skins. Process Biochem., 30:457-462, 1995.
Cochran, W.G., and Cox, G.M. Experimental designs, 2nd edn. John Wiley and sons New York, pp. 335-375, 1992.
Fannin, T. E, Marcus, M.D., Anderson, D.A. and Bergman, H.L., Use of a fractional factorial design to evaluate interactions of environmental factors affecting biodegradation rates. Appl. Environ. Microbiol., 42: 936-943, 1981.
Deshayes, C.M.P., Utilisation de modeles mathematiques pour i optimisation en fermentation, applications aux transformations par les micro-organismes, Bull. Soc. Chim. Fr., 1: 24-34, 1980.
Matthews, R.J., Scott, R.G., and Morgan, S.L., Characterization of an enzymatic determination of arsenic (v) based on response surface methodology. Anal. Chim. Acta., 133:169-182, 1981.
Box, G.E.P., Hunter, W.G. and Hunter, J.S. Statistics for experiments. John Wiley and Sons, New York, pp. 291-334, 1978.
Akhnazarova, S., and Kafarov, V. Experiment optimization in chemistry and chemical engineering, Mir Publications, Moscow, 1982.
Cochran, W.G., and Cox, G.M. Experimental designs, 2nd edn. John Wiley and sons, New York, pp. 346-354, 1957.
Yee, L. and Blanch, H.W. Defined media optimization for the growth of recombinant Escherichia coli x90. Biotechnol. Bioeng., 41, 221-227, 1993.
Kenneth, W.Y., Mak Miranda, G.S. and Yap Wah Koon T. Formulation and optimization of two culture media for the production of tumor necrosis factor-b in Escherichia coli. J. Chem. Tech. Biotechnol., 62: 289-294, 1995.
Box, G.E.P. and Wilson, K.B. On the experimental attainment of optimum conditions. J. Roy. Stat. Soc., B13:1-45, 1951.
Khuri, A.I., and Cornell, J.A. Response surfaces: Design and analysis. Marcel Dekker, Inc, New York, 1987.
Adinarayana, K., Optimization of alkaline protease by response surface methodology using Bacillus PE-11, M. Pharm dissertation, Andhra University, Visakhapatnam, 2000.
Tsuchida, O., Yamagota, Y., Ishizuka, J., Arai, J., Yamada, J., Takeuchi, M. and Ichishima, E., An alkaline proteinase of an alkalophilic Bacillus sp. Curr. Microbiol., 14 : 7-12, 1986.
Kole, M.M., Draper, J. and Gerson, D.F. Production of protease By Bacillus Subtilis using simultaneous control of glucose and ammonium concentrations. J. Chem. Technol. Biotechnol., 41:197-206, 1988.
Cruegar, W., and Cruegar, A. Biotechnology – A Textbook for Industrial Microbiology. Madison, W1: Science Tech Inc., 1984.
Frankena, J., Koningstein, G.M., Van Verseveld, H.W. and Stouthamer, A.H., Effect of different limitations in chemostat cultures on growth and production of exocellular protease by Bacillus licheniformis. Appl. Microbiol. Biotechnol., 24:106-112, 1986.
Giesecke, U.E., Bierbaum, G., Rudde, H., Spohn, U. and Wandrey, C., Production of alkaline protease with Bacillus licheniformis in a controlled fed-batch process. Appl. Microbiol. Biotechnol., 35:720-724, 1991.
Conely, W.C. Computer optimization techniques. Petrocelli Books, Princeton, New Jersy, pp. 147-163, 1984.
Corresponding Author: P. Ellaiah, Pharmaceutical Biotechnology Division, Department of Pharmaceutical Sciences, Andhra University, Visakhapatnam-530003. adikunamneni@rediffmail.com
Published by the Canadian Society for Pharmaceutical Sciences.
Copyright © 1998 by the Canadian Society for Pharmaceutical Sciences.
http://www.ualberta.ca/~csps

