J Pharm Pharmaceut Sci (www.cspscanada.org) 8(2):190-198, 2005
Application of capillary zone electrophoresis with indirect UV detection to the determination of a model drug, vigabatrin, in dosage forms.
Alireza Shafaati*1,2, Charles Lucy1
1Department of Chemistry, Gunning/Lemieux Chemistry Centre, University of Alberta, Edmonton, Alberta, Canada
2Department of Pharmaceutical Chemistry, School of Pharmacy, Shaheed Beheshti University of Medical Sciences, Tehran, IranReceived 3 December 2004, Revised 10 March 2005, Accepted 10 March 2005, Published 3 August, 2005
Abstract
PURPOSE: Vigabatrin, an anti-epileptic drug with poor UV absorptivity, is used as a model drug to investigate parameters affecting quantitative determination of cationic drugs using capillary zone electrophoresis with indirect UV detection. METHODS: All experiments were performed on a HP 3D CE instrument equipped with an on-column diode array UV absorbance detector. Untreated fused silica capillaries with an inner diameter of 50 mm, an outer diameter of 365 mm, and a total length of 50 cm (41.5 cm to the detector) were used. Indirect UV detection was performed at 214 nm. Operational parameters such as buffer type and concentration, its pH, probe type and concentration, and the impact of co-ions on the efficiency of separation, were studied. Sabrilexâ sachets and Sabrilâ tablets were subjected to analysis in this study. RESULTS: Optimal separation and quantification of vigabatrin was obtained using 5 mM sodium phosphate buffer containing 5 mM benzyl tri-ethyl ammonium hydroxide (BTEA) at pH 2.2, with 8-aminocaprylic acid as the internal standard. The method was linear over a range of 5-150 mg/ml (r = 0.9911) and a wider range of 100-600 mg/ml (r = 0.9937) concentration of the drug. The relative standard deviation (RSD) of migration time for 10 consecutive injections of a standard solution of vigabatrin was 0.19%. The limit of quantification (LOQ) was 5 mg/ml. CONCLUSIONS: The method was demonstrated for quantification of vigabatrin in both tablet and sachet dosage forms and proved to be a very specific and fast (8 min) means of routine analysis of the drug in dosage forms, in assay or dissolution testing.
Introduction
Vigabatrin (4-amino-5-hexenoic acid) is structurally related to γ-amino butyric acid (GABA) (Figure 1), an inhibitory neurotransmitter in the brain. Vigabatrin indirectly increases the levels of GABA, by inhibiting GABA transaminase (GABA-T), an enzyme responsible for the degradation of GABA, which appears to be responsible for the anti-epileptic action of the drug (1). Vigabatrin is indicated as sachets (for oral solution) or tablets for the adjunctive management of epilepsy that is not satisfactorily controlled by conventional therapy. Vigabatrin is indicated as initial monotherapy for the management of infantile spasms (West syndrome) (2).
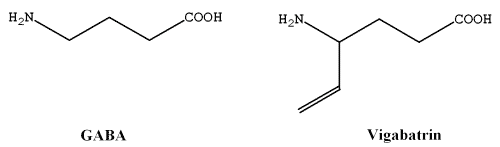
Figure 1: Chemical structure of γ aminobutyric acid (GABA) and its structurally related drug, vigabatrin.
Vigabatrin has been determined in different matrices, including dosage forms and biological samples by gas chromatography (GC) (3-5), high-performance liquid chromatography (HPLC) (6-11), spectrofluorimetry (12-14) and capillary electrophoresis (CE) using derivatization of the drug with fluorescence tags (15, 16). Vigabatrin exhibits a very low UV absorption. Consequently, poor sensitivity is achieved with conventional UV spectrophotometric methods. Thus, derivatization of the drug is necessary if measurement of vigabatrin is intended by UV/Vis or spectrofluorimetric detection. o-Phthaldialdehyde (OPA), dansyl chloride and 4-chloro-7-nitrobenzofurazan (NBD-Cl) have been commonly used as derivatizing agents for fluorescence detection (15). However, in general labeling reactions are time consuming, sometimes require non-aqueous conditions, and may produce numerous side-products (17).
The employment of CE for the analysis of drugs and pharmaceuticals has been demonstrated in excellent reviews (18, 19). The popularity of CE in the pharmaceutical fields has been accelerated by its simplicity, high efficiency and selectivity, and large separation capacity. Indirect UV detection is often used in CE for the analysis of chemical compounds that lack an intrinsic chromophore or fluorophore. In indirect detection, an absorbing or fluorescing ion, typically called the probe, is added to the buffer. The probe ions are displaced by analyte ions of the same charge and similar mobilities. Displacement of the probe by the analyte produces a decrease in signal (20,21). The main advantage of indirect photometric detection is that it offers universal detection.
There are only a few reports discussing the use of CE with indirect detection for drugs and pharmaceuticals (22). The aim of this work was to explore the potential of indirect UV detection for determination of vigabatrin, a cationic model drug with poor UV absorptivity, in its pharmaceutical dosage forms.
Materials and Methods
Materials
All solutions were prepared with Nanopure 18 MΩ water (Barnstead, Chicago, IL, USA).
Vigabatrin and 8-aminocaprylic acid (internal standard, I.S.) were purchased from Sigma (St. Louis, MO, USA), benzyl triethyl ammonium hydroxide (BTEA) was obtained from Lancaster (Winham, USA) as a 40% solution in methanol. All of the chemicals used were reagent grade or better, and were used without further purification.
Buffers were prepared from hydrated sodium salts of dihydrogen orthophosphate (BDH, Toronto, Canada) after the required amount of BTEA had been added. The pH was measured using a Model 445 digital pH meter (Corning, Acton, USA) calibrated with aqueous standards immediately prior to use. The pH was adjusted using 0.1 M phosphoric acid or 0.1 M NaOH (BDH).
Vigabatrin sachets were purchased as Sabrilexâ 0.5 g (Aventis Pharma S.A., Marion Merrell, S.A. Madrid) with expiration date of 08.2005 from Noor Pharmacy in Tehran, Iran. Vigabatrin tablets were obtained as Sabrilâ 0.5 g (Aventis Pharma Inc., Laval, Quebec, Canada) with expiration date of 12.2006 from the Main Pharmacy, University of Alberta Hospital, Edmonton, Canada.
CE Instrument and conditions
All experiments were performed on a HP 3D CE (Hewlett-Packard, now Agilent, Palo Alto, CA, USA) instrument equipped with an on-column diode array UV absorbance detector. Data acquisition (at 20 Hz) and control were preformed using ChemStation software (HP 3D, Hewlett-Packard) for Windows 95 on a Pentium II personal computer. Untreated fused silica capillaries (Polymicro Technologies, Phoenix, AZ, USA) with an inner diameter of 50 mm, an outer diameter of 365 μm, and a total length of 50 cm (41.5 cm to the detector) were used. In all experiments, the capillary was maintained at 25°C. Samples were introduced by hydrodynamic injection (50 mBar pressure injection) for 5 sec at the anodic end of the capillary and detected at 214 nm. The optimum capillary rinse procedure was 1 min rinse with phosphoric acid 0.1 M and 2 min rinse with the running buffer. The rinsing pressure was 940 mBar. A BTEA buffer was used for 10 consecutive runs before it was replaced with a new buffer vial. Electrolysis caused by the applied voltage can alter the pH within the electrolyte reservoirs (23). This is particularly true with indirect detection where dilute buffers are used. Thus, it is important to replace the vials regularly to maintain the buffer conditions, and thereby migration time reproducibility. Separations were performed at 25 kV, which was experimentally determined to be within the linear portion of the Ohm's plot.
Sample preparations
Sachets- Contents of 5 Sabrilexâ sachets were mixed and accurately weighed. Then, a portion of the powder equivalent to 500 mg of vigabatrin was weighed and transferred to a 100 ml volumetric flask. Ten milliliter of I.S. solution (50 mg/ml in 0.05 M HCl) was quantitatively transferred to the flask and the solution was brought to volume with water. The mixture was filtered into a flask using a Whatman filter paper No. 1 (Whatman International Ltd., Maidstone, England). Then, 2 ml of the filtrate and 10 ml of sodium phosphate buffer 5 mM (without the probe) were quantitatively transferred to a 100 ml volumetric flask and water was added to volume, to obtain a final test solution containing 100 mg/ml each of the drug and I.S.
Tablets- Five Sabrilâ tablets were weighed, powdered and ground with a mortar and pestle for 5 min. An amount equivalent to one tablet was accurately weighed and transferred to a 100 ml volumetric flask. Then, a test solution was obtained as described for sachets.
ResultS and Discussion
Preliminary Experiments
Correctly choosing an indirect detection probe and providing suitable buffering of the background electrolyte are very important factors in the development of a robust analytical method. Vigabatrin is an amphoteric compound that bears a positive charge in low pH buffers. Thus, to begin method development a 10 mM sodium phosphate buffer at pH 2.5 was prepared and used as running buffer. Further modifications were performed on the buffer composition and pH as described below.
Probe Type and Concentration
Selection of the probe is governed by consideration of its mobility, spectral and basic physicochemical properties. The limit of detection is indirectly related to the molar absorptivity of the probe (24). In addition, the mobility and concentration of the probe are crucial for the separation performance of the method, because they influence peak shape and efficiency (21). In the case of vigabatrin, aromatic amines were considered suitable probes, as they exist as cations with appropriate chromophores in acidic buffers. Naphthyl amines, p-amino acetanilide and 8-amino quinoline were found to be ideal for indirect detection of vigabatrin, providing peak efficiencies as high as 1.5 × 10⁵. However, all of these aromatic amines showed rapid discoloration at the inlet buffer reservoir upon application of the high voltage across the capillary. This effect caused gradual deterioration of the separation efficiencies over consecutive runs, resulting in poor reproducibility. To avoid any unsatisfactory effect on the method robustness, aryl aromatic amines including benzyl amine and its N-methyl and N-ethyl derivatives were tested as potential probes. Amongst these benzyl triethyl ammonium (BTEA) yielded the best peak shape and efficiency, and so was used in all further experiments.
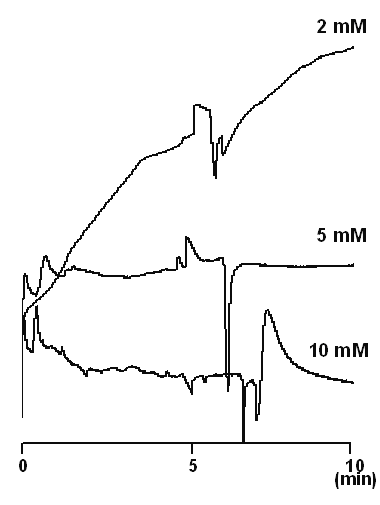
Generally indirect absorption detection is performed with the concentration of the probe in the range of 2-20 mM (24). Low concentrations are favored as they minimize the limit of detection, but can suffer from increased peak broadening due to electrodispersion (21,22). On the other hand, high probe concentrations may affect the linearity of the detection and the noise level, and hence increase limit of detection (25). The effect of BTEA concentration on the peak shapes of the drug and I.S. is illustrated in Figure 2. A BTEA concentration of 5 mM yielded a stable baseline and reasonable resolution between the drug and better peak shapes. Thus, this concentration of probe was used in all further experiments.
Figure 2: Effect of the probe (BTEA) concentration on the separation efficiency and peak shapes at pH 2.5. Sample solution contained only vigabatrin. Separation was made using untreated fused silica capillaries with an inner diameter of 50 mm, an outer diameter of 365 mm, and a total length of 50 cm (41.5 cm to the detector). In all experiments, the capillary was thermostatted at 25°C, the applied voltage was 25 kV and samples were detected at 214 nm. The running buffer was sodium phosphate buffer at pH 2.5.
Buffer Composition and pH
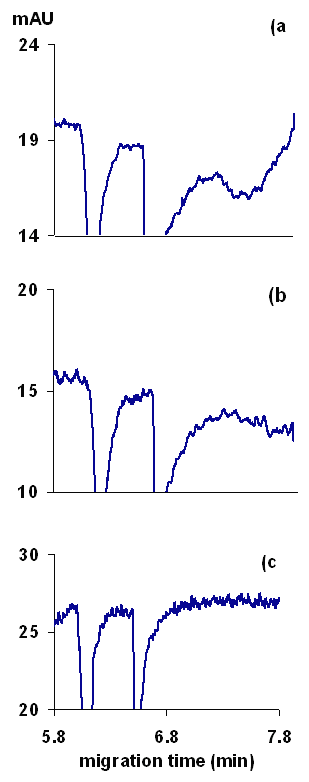
The necessity of buffering background electrolyte for CE methods, especially for indirect detection, has been demonstrated clearly by numerous authors (19,20,24). However, buffering must be done carefully to not degrade the sensitivity of indirect detection. The addition of buffer components that are co-ions to the analyte results in analyte ions displacing the buffer ions rather than the probe, which causes a reduction in the detection sensitivity (19). Also, the addition of buffer co-ions (ions with same charge as the analyte ions, such as Na+ in our case) to the running buffer results in additional system peaks that complicate method development. A number of means of buffering designed to maximize method robustness while maintaining sensitivity and simplicity have been developed (24). In our study, the simplest approach would be to prepare a 5 mM solution of BTEA and to control the pH with 1 mM phosphoric acid. This avoids the introduction of any co-ions. Surprisingly, using a BTEA-phosphoric acid buffer resulted in large system peaks and tailed signal peaks for both the drug and I.S. Addition of sodium or magnesium ions (as chlorides) to the buffer, largely reduced the system peaks and peak tailing (Figure 3). The peak tailing was attributed to the adsorption of the probe and /or the analyte ions onto the capillary wall. Adsorption of probe molecules can cause baseline noise and artifacts in indirect detection (26). Alternately, adsorption of the drug on the capillary causes poor separation efficiencies, as recently reported in chiral CE separations of glycopeptide antibiotics (27).
Figure 3: Effect of running buffer composition on peak shapes, (a) buffer containing BTEA and phosphoric acid, (b) the same buffer as in (a) but 6 mM sodium chloride was added to the buffer, and (c) the same buffer as (a) but 4 mM magnesium chloride was added to the buffer. Other conditions as in Figure 2.
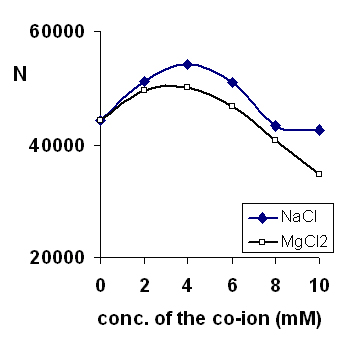
Green and Jorgenson introduced the use of alkali metal additives to prevent adsorption of proteins on capillary surfaces in CE (28). In our work, the sodium and magnesium ions compete with the BTEA, vigabatrin and I.S. for the adsorption sites on the capillary surface. The effect of the added cation on the peak efficiency (as number of theoretical plates) is shown in Figure 4. The peak efficiency initially increases with addition of cations to the running buffer, reflecting a decrease in wall adsorption. However, at higher cation concentrations, the efficiency again decreased. Presumably, this decrease is due to electrodispersion caused by the difference in the mobility of Na+/Mg2+ and the drug/probe.
Figure 4: Separation efficiency (shown as N, the number of theoretical plates) over a range of the Na and Mg ions added to the running buffer. Other conditions as in Figure 2.
Magnesium yielded sharper and more symmetric peaks, as would be expected from its greater affinity to the silica surface (29). However, it also caused greater high frequency noise in the baseline. Thus, sodium ions were preferred as additives to the running buffer. The highest efficiency and most reproducible results were obtained when 5 mM sodium chloride was added to the buffer. However to minimize system peaks, phosphate was used as the sodium counter-ion rather than chloride. In addition, use of sodium phosphate along with phosphoric acid yielded greater buffering capacity for the running buffer. Thus, the final buffer composition was then 5 mM sodium dihydrogen phosphate and 5 mM BTEA. Phosphoric acid (1 M) was used to adjust the pH of the buffer.
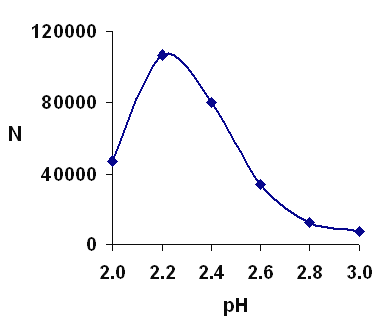
Figure 5 shows the effect of the pH of the buffer in a range of 2-3. It was clear from the results that pH 2.2 would result in higher efficiency. Considering the pKa of carboxylic moiety (pKa is about 4.7) and pKa of amine moiety (pKa is about 8.6), vigabatrin is almost completely positively charged at pH 2.2.
Figure 5: Separation efficiency over a range of pH. Other conditions as in Figure 2.
Capillary Rinsing Protocol
Once the acidic buffer conditions had been established for the indirect UV detection of vigabatrin and I.S. in acidic buffer the effect of between-run rinses of the capillary on the repeatability of the method was studied.
In CE, it is important to rinse the capillary between runs to regenerate the silanol functionality on the capillary surface. This ensures a reproducible electroosmotic flow, and thus reproducible migration times. Traditionally, alkaline rinses are used.
Table 1 shows the reproducibility observed for ten consecutive injections of a standard solution of 100 mg/ml vigabatrin and I.S. using between-run rinses at 940 imBar of 0.1 M NaOH for 1 min, followed by water for 1 min, and then the running buffer for 2 min. The same repeatability experiment was performed using acidic between-run rinses consisting of 0.1 M phosphoric acid rinse for 1 min, followed by the buffer for 2 min. Better reproducibility was obtained using the acid rinse cycle (Table 1). This is possibly a reflection of the smaller change in pH between the running buffer and the rinses. Acid rinses, as described in the Materials and Methods, were used for all analyses.
Table 1: Repeatability of the method under two protocols for rinsing the capillary between runs. Conditions as in Figure 5.
Validation Assessments
The benefits of using an internal standard in quantitative CZE has been demonstrated elsewhere (30). Peak height ratios of vigabatrin to the I.S. were used for quantitative measurements in this study because the peak tailing due to adsorption of probe and /or analytes could not be completely eliminated, making quantification using peak area imprecise.
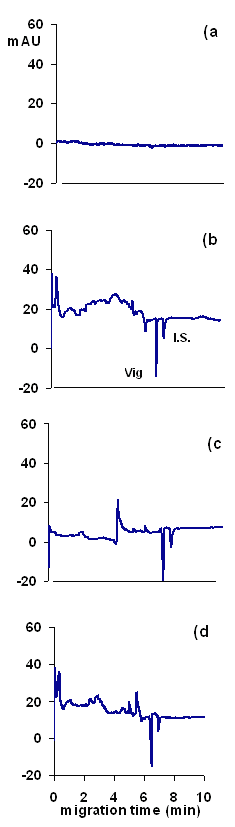
Specificity- The specificity of the method was evaluated by analyzing sachets and tablets to see if any of the other components within these interfered with analyses. As shown in Figure 6, no interferences were observed with the proposed method. The larger amount of excipients generally used in tablets caused large system peaks. However, these system peaks appeared before the analyte peak, and thus did not interfere. Further, no shifts in migration time relative to pure vigabatrin standards were observed with either the sachets or tablets.
Figure 6: Electropherograms of (a) a blank solution, (b) a standard solution of 100 mg/ml of vigabatrin (Vig) and 100 μg/ml of the I.S., and (c) a tablet extract, and (d) a sachet extract, both containing the same concentration of the drug and I.S. as in the (b). The running buffer was phosphate buffer 5 mM sodium at pH 2.2 containing 5 mM BTEA as the probe. Other conditions as in Figure 2.
Repeatability-The results of 10 consecutive injections of a standard solution of vigabatrin are shown in Table 1. The low RSD values obtained by acid-rinse cycle demonstrate a precise method, which confirms the applicability of the method for the drug assay. This reproducibility experiment was repeated on 3 consecutive days (only the acid-rinse cycle was performed between runs). The RSD values for the migration time and peak-height ratio on 3 consecutive days were 0.6% and 2.3%, respectively. This indicates that the method is robust, and could be employed as a routine method for quality control of vigabatrin dosage forms.
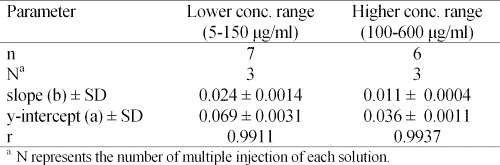
Linearity- Linearity of the peak height ratio of vigabatrin/I.S. over two ranges of concentrations of vigabatrin was assessed. The lower concentration range was 5-150 mg/ml, starting at 5 mg/ml followed by 25 mg/ml and continuing at 25 mg/ml intervals. The higher concentration range was 100-600 ìg/ml at 100 ìg/ml intervals. The first concentration range covered a 5-150% range of the nominal concentration of 100 mg/ml. The linearity of the method over the second concentration range was studied to demonstrate applicability of the method for the assay of vigabatrin in tablet dissolution testing.
The results, given in Table 2, clearly show that linear response can be obtained in both ranges of the drug concentration.
Table 2: Results of linearity assessment of the method over two ranges of vigabatrin concentration. Conditions as in Figure 5.
Limit of Detection- In dosage form assay, limits of detection (LOD) or quantification (LOQ) of the analytical method are not important parameters. However, for dissolution profile testing of vigabatrin tablets, the sensitivity of the method is important. The LOD of the method was determined using the method described by Melanson et al. (17), and found to be 1.5 mg/ml. The LOQ was 5 mg/ml (3 times of LOD). This LOQ is sufficiently low to cover down to 5% release of the drug from tablet dosage form.
Determination of vigabatrin in dosage forms
Three sachet extracts and 3 tablet extracts and a standard solution of vigabatrin (all prepared in exactly the same way, as described in Sample Preparation section) were analyzed with the CE method. The concentrations were then determined from the calibration data (obtained over the lower concentration range of the drug). The recovery of vigabatrin from sachets was 99.4 - 100.4% and from tablets was 98.6 - 101.3%. The greater variations in recovery of the drug from tablet dosage form was attributed to the higher excipient content of the dosage form and the insolubility of some excipients which reduced the efficiency of the extraction of vigabatrin, especially during the filtration process. Figure 6 shows electropherograms of a standard solution of the drug and extracts of SabrilÒ tablets and SabrilexÒ sachets.
Conclusions
The proposed CE method with indirect UV detection is a simple, fast and robust method for the analysis of vigabatrin in dosage forms. The method also provides a simple solution for the problem of low UV absorptivity of the drug and proved to be less tedious than the reported analytical methods. Thus, it can be considered as a reliable and practical quality control of vigabatrin in its pharmaceutical dosage forms.
Acknowledgments
We wish to thank The Vice Chancellor for Research Affairs of Shaheed Beheshti University of Medical Sciences (SBMU) for the financial support of this work. Financial support for the work was also provided by the Natural Sciences and Engineering Research Council of Canada (NSERC) and the University of Alberta.
References
Gale, K. and Iadarola, M.J., Seizure protection and increased nerve-terminal GABA: delayed effects of GABA transaminase inhibition. Science, 208:288-291, 1980.
Perucca, E., Clinical pharmacology and therapeutic use of the new antiepileptic drugs. Fundam Clin Pharmacol, 15:405-417, 2001.
Haegele, K.D.; Schoun, J.; Alken, R.G. and Huebert, N.D., Determination of the R(-)- and S(+)-enantiomers of gamma-vinyl-gamma-aminobutyric acid in human body fluids by gas chromatography--mass spectrometry. J Chromatogr, 274:103-110, 1983.
Schramm, T.M.; McKinnon, G.E. and Eadie, M.J., Gas chromatographic assay of vigabatrin enantiomers in plasma. J Chromatogr, 616:39-44, 1993.
Williams, J.; Bialer, M.; Johannessen, S.I.; Kramer, G.; Levy, R.; Mattson, R.H.; Perucca, E.; Patsalos, P.N. and Wilson, J.F., Interlaboratory variability in the quantification of new generation antiepileptic drugs based on external quality assessment data. Epilepsia, 44:40-45, 2003.
Smitheres, J.A.; Lang J.F. and Okerholm R.A., Quantitative analysis of vigabatrin in plasma and urine by reversed-phase high-performance liquid chromatography. J Chromatogr, 341:232-238, 1985.
Chen, T.M.; Contario, J.J. and Fike, R.R., High-performance liquid chromatographic assay for vigabatrin and its primary degradation product in a pharmaceutical tablet formulation. J Chromatogr, 398:351-354, 1987.
Tsanaclis, L.M.; Wicks, J.; Williams, J. and Richens, A., Determination of vigabatrin in plasma by reversed-phase high-performance liquid chromatography. Ther Drug Monit, 13:251-253, 1991.
Wad, N. and Kramer, G., Sensitive high-performance liquid chromatographic method with fluorometric detection for the simultaneous determination of gabapentin and vigabatrin in serum and urine. J Chromatogr B, 705:154-158, 1998.
Krivanek, P.; Koppatz, K. and Turnheim K., Simultaneous isocratic HPLC determination of vigabatrin and gabapentin in human plasma by dansyl derivatization. Ther Drug Monit, 25:374-377, 2003.
Cetin, S.M. and Atmaca, S., Determination of vigabatrin in human plasma and urine by high-performance liquid chromatography with UV-Vis detection. J Chromatogr A, 1031:237-242, 2004.
Hassan, E.M.; Belal, F.; Al-Deeb, O.A. and Khalil, N.Y., Spectrofluorimetric determination of vigabatrin and gabapentin in dosage forms and spiked plasma samples through derivatization with 4-chloro-7-nitrobenzo-2-oxa-1,3-diazole. J AOAC Int, 84:1017-1024, 2001.
Belal, F.; Abdine, H.; Al-Majed, A. and Khalil, N.Y., Spectrofluorimetric determination of vigabatrin and gabapentin in urine and dosage forms through derivatization with fluorescamine. J Pharm Biomed Anal, 27:253-260, 2002.
Olgun, N.; Erturk, S. and Atmaca, S., Spectrofluorimetric and spectrophotometric methods for the determination of vigabatrin in tablets. J Pharm Biomed Anal, 29:1-5, 2002.
Chang, S.Y. and Lin, W.C., Determination of vigabatrin by capillary electrophoresis with laser-induced fluorescence detection. J Chromatogr B, 794:17-22, 2003.
Benturquia, N.; Parrot, S.; Sauvinet, V.; Renaud, B. and Denoroy, L., Simultaneous determination of vigabatrin and amino acid neurotransmitters in brain microdialysates by capillary electrophoresis with laser-induced fluorescence detection. J Chromatogr B, 806:237-244, 2004.
Melanson, J.E.; Wong, B.L.Y.; Boulet, C.A. and Lucy, C.A., High-sensitivity determination of the degradation products of chemical warfare agents by capillary electrophoresis-indirect UV absorption. J Chromatogr A, 920:359-365, 2001.
Altria, K.D. and Elder, D., Overview of the status and applications of capillary electrophoresis to the analysis of small molecules. J Chromatogr A, 1023:1– 14, 2004.
Altria, K.D.; Chen, A.B. and Clohs, L. Capillary Electrophoresis as a Routine Analytical Tool in Pharmaceutical Analysis. LCGC, 19(12): 2-7, 2001.
Macka, M.; Johns, C.; Doble, P. and Haddad, P.R., Indirect photometric detection in CE using buffered electrolytes-Part I, principles. LCGC, 19(1):38-47, 2001.
Macka, M.; Johns, C.; Doble, P. and Haddad, P.R., Indirect photometric detection in CE using buffered electrolytes-Part II, practical rules. LCGC, 19(2):178-188, 2001.
Altria, K.D.; Wallberg, M. and Westerlund, D. Separation of a range of cations by nonaqueous capillary electrophoresis using indirect and direct detection. J Chromatogr B, 714:99-104, 1998.
Macka, M.; Anderson, P. and Haddad, P.R. Anal. Chem. 70:743-749, 1998.
Johns, C.; Macka, M. and Haddad, P.R., Enhancement of detection sensitivity for indirect photometric detection of anions and cations in capillary electrophoresis. Electrophoresis, 24:2150-2167, 2003.
Xu, X.; Kok, W.T. and Poppe, H., Noise and baseline disturbances in indirect UV detection in capillary electrophoresis. J Chromatogr A, 786:333-345, 1997.
Choy, T.M.H. and Huie C.W. Investigation of the effects of wall adsorption of the visualization agent on baseline noise characteristics for indirect UV detection in capillary electrophoresis. Electrophoresis, 24:3030-3048, 2003.
Jiang, Z.G.; Kang, J.W.; Bischoff, D.; Bister, B; Sussmuth, R.D. and Schurig V., Evaluation of balhimycin as a chiral selector for enantioresolution by capillary electrophoresis. Electrophoresis, 25:2687-2692, 2004.
Green, J. and Jorgenson, J.W., Minimizing adsorption of proteins on fused-silica in capillary zone electrophoresis by the addition of alkali-metal salts to the buffers. J Chromatogr, 478:63-70, 1989.
Mammen, M.; Carbeck, J.D.; Simanek, E.E. and Whitesides G.M., Treating electrostatic shielding at the surface of silica as discrete siloxide center dot cation interactions. J Am Chem Soc, 119:3469-3476, 1997.
Shafaati, A. and Clark, B.J., Determination of azathioprine and its related substances by capillary zone electrophoresis and its application to pharmaceutical dosage forms assay. Drug Dev Indust Pharm, 26:267-273, 2000.
Corresponding Author: Alireza Shafaati, Department of Pharmaceutical Chemistry, School of Pharmacy, Shaheed Beheshti University of Medical Sciences, Tehran, Iran. ashafaati@yahoo.com
Published by the Canadian Society for Pharmaceutical Sciences.
Copyright © 1998 by the Canadian Society for Pharmaceutical Sciences.
http://www.cspscanada.org