J Pharm Pharmaceut Sci (www.cspscanada.org) 8(2):340-347, 2005
Validation of a Selective Method for Determination of
Paroxetine in human plasma by LC-MS/MS
Massaroti,
P.; Cassiano, N. M.; Duarte, L. F.; Campos, D. R.; Marchioretto,
M. A. M.; Bernasconi, G.; Calafatti, S.; Barros, F. A. P.; Meurer, E.C.; Pedrazzoli, J.
Clinical Pharmacology and
Gastroenterology Unit,
Received
April 6, 2005 ,Revised June 22, 2005, Accepted June 22, 2005, Published August
17, 2005
Correspondence to: Eduardo Cesar Meurer, UNIFAG,
Universidade Sao Francisco, Sao Francisco de Assis Ave. 218, 12.916.900,
Braganca Paulista, SP, Brazil. E-mail: eduardo.meurer@saofrancisco.edu.br
ABSTRACT
Purpose. A sensitive, robust, and selective liquid chromatographic – tandem mass
spectrometric method (LC-MS/MS) was developed and validated for paroxetine
quantification in human EDTA plasma. Methods. Sample preparation was
based on liquid-liquid extraction using a mixture of ethyl acetate/hexane
(50/50; v/v) to extract the drug and internal standard from plasma. Chromatography
was performed on a C-18 analytical column and the retention times were 1.6 and
1.7 for paroxetine and fluoxetine (IS), respectively. The ionization was
optimized using ESI(+) and selectivity was achieved by tandem mass
spectrometric analysis using MRM functions, 330.0 →
70.0 and 310 → 43.9 for paroxetine and fluoxetine. Results.
Analytical curve ranged from 0.2 to 20.0 ng/mL. Inter-day precision and
accuracy of the quality control (QC) samples were < 15% relative standard
deviation (RSD). Analyte stability during sampling processing and storage were
established. Conclusion. Validation results on linearity, specificity,
accuracy, precision as well as application to the analysis of samples taken up
to 120 h after oral administration of 20 mg of paroxetine in 28 healthy
volunteers were found to be of good performance in bioequivalence study.
INTRODUCTION
Paroxetine
(5-(4-p-Fluorophenyl-3-piperidy-lmethoxy)-1,3-benzodioxole, CAS –
61869-08-7) is a phenylpiperidine compound that acts as a potent and selective
serotonin reuptake inhibitor (SSRI)(1). Its action appears to account for the
antidepressant activity observed with this class of drugs
(2) that is safe and effective for treatment of depressive and
obsessive-compulsive disorders (3). This drug bioavailability is not affected
by food or antacids; it means half-life of 24 hours is consistent with
once-a-day dosing (4), and undergoes a first pass metabolism which reduces the
bioavailability at therapeutic doses to about 30-60%. Maximum blood levels are
reached 2 to 8 hours after oral administration. In the plasma 95% of the drug
is bounded to protein. Paroxetine is eliminated after transformation in the
liver into pharmacologically inactive metabolites. Although clinical practice
has not reported problems of the drug interactions so far, comedications with
tricyclic antidepressants should be avoided. The most frequent side effects of
paroxetine concern nausea and somnolescence (5).
Different
methods dedicated to the determination of Paroxetine in biological fluids have
already been reported. Such methods had used gas chromatography (GC) with
nitrogen and MS detections (6) or
liquid chromatography (LC) with UV (7) or mass spectrometric analysis (8-10).
To our knowledge, this is the low solvent consuming and best recovery mass
spectrometric analysis method applied to bioequivalence so far reported.
This
paper describes a validated method combining liquid-liquid extraction,
reversed-phase LC and MS/MS detection to perform the selective determination of
Paroxetine. Tandem mass spectrometry was selected in order to improve the
selectivity and sensitivity of the method of determination. The LC conditions,
the type of extractor solvent and the MS/MS optimization were investigated in
order to select the most appropriate operating conditions. The validation of
the method was performed considering parameters such as linearity of the
chromatographic response, precision and accuracy that meets the accepted
criteria for bioanalytical method validation (11), and employed in
bioequivalence study of two paroxetine 20 mg paroxetine tablet formulations
(standard and reference).
EXPERIMENTAL
Chemical
Paroxetine
(lot number R40285) and fluoxetine (lot number F-1) were obtained from Zydus Cadila Healthcare Limited and U.S. Pharmacopeia, respectively. Acetonitrile and
methanol (HPLC grade), n-hexane were purchased from Mallinckodt (St Louis, MO,
USA) while formic acid, ethyl acetate, sodium hydroxide p.a. from Merck
(Darmstadt, Germany). The water was purified using a Milli-Q system
(Millipore Corporate Headquarters, USA).
Equipment and columns
The LC
system used was an Agilent (Agilent Technologies, Inc., Palo Alto, CA) liquid
chromatograph equipped with an isocratic pump (1100 series), an auto-sampler
(1100 series) and a degasser (1100 series). Mass spectrometric analysis was
performed using a Quattro Micro (triple-quadrupole) instrument from Micromass
(Manchester, UK) working with ESI interface. The data acquisition and system
controlling were obtained using MassLynx version 3.5 software from Micromass.
Nitrogen was produced by an on-site nitrogen generator from Jun-Air.
The used
stationary phase for paroxetine analytical run was C18 packed in a (50 x 2.0
mm) Polaris 5 µm particle size column from VarianÒ. All analytical runs were preceded by a
Securityguard column packed with C18 from PhenomenexÒ
(Torrance, CA, USA).
LC-MS/MS conditions
All
chromatographic experiments were carried out in the isocratic mode at room
temperature. The mobile phase for the chromatographic run was a solution of
formic acid 0.1% in acetonitrile: water (6:4; v/v) pumped at a flow rate of
0.15 mL/min. The injection volume was 10 µL and the total run time is set for
2.6 min and typical standard retention times were 1.6 min for paroxetine and
1.7 min for fluoxetine.
Mass
spectrometric analysis was performed using Quattro Micro equipment working with
an ESI source in the positive ion mode. The conditions used for such analysis
are: dessolvation gas (N2) flow-rate was 280 L/h, cone gas flow-rate
was 70 L/h, the source and dessolvation gas temperatures were 100oC
and 350oC respectively and the ESI source tip voltage of 4.4 kV. The
mass spectrometer generated the protonated molecules (MH+) of m/z
330 and m/z 310 for paroxetine and fluoxetine (IS) respectively. These
parent ions (MH+) of m/z
330 for paroxetine and of m/z 310
for IS were selected using the first quadrupole analyzer (Q1) and
then dissociated into the second quadrupole used in rf/only mode (collision
cell, q2) with a collision energy of 30 eV for paroxetine and 10 eV
for fluoxetine using Argon as collision gas. The product ions of m/z 70
for paroxetine and m/z 44 for IS were monitored via the third quadrupole
mass analyzer (Q3).
Preparation of Calibration Standards
Stock solution of paroxetine was prepared by
dissolving the drug in methanol obtaining a final concentration of 100 mg/mL. An aliquot of this solution was placed in a
glass tube and the solvent was evaporated under a compressed air stream. The
dried analyte was reconstituted using blank plasma to a final concentration of
1000 ng/mL and the solution was vortex-mixed for 15s. From this solution six
calibration standard solution containing 0.2, 0.5, 1.0, 5.0, 10.0, 20.0 and
three quality controls solutions at concentrations of 0.6, 8.0 and 16.0 ng/mL
were prepared in blank plasma.
Aliquot (0.5 mL) of plasma standards were dispensed in
into properly labelled eppendorff tubes and stored at -70 ºC until
required for assay. For each assay, one tube of each concentration is thawed
immediately before sample extraction, giving enough volume for analyses.
Stock solution of fluoxetine internal standard was
prepared dissolving the drug in methanol to a final concentration of 100 mg/mL. This solution was diluted with methanol to a
final concentration of 500 ng/mL.
Sample preparation
The procedure of extraction was applied for all
subject samples, analytical curve and quality control standards. All frozen
human plasma samples were previously thawed to room temperature. In order to
perform the sample extraction, 0.5 mL of sample (in human plasma) was dispensed
in Eppendorff vials, after that added to this plasma 100 µL of 0.1 mol/L sodium
hydroxide, 25 µL of 500ng/mL fluoxetine standard solution and vortex-mixed
during 1 min. Then 1000 µL of a ethyl acetate/hexane (50:50; v/v) was added to
vials and vortex-mixed again during 10 min. The mixture were centrifuged at
14000 rpm, during 10 min, at 4oC, the upper organic phase (700 µL)
was transferred to another Eppendorff vial and evaporated to dryness under a
compressed air stream. The residues were reconstituted with 100 µL of mobile
phase and 10 µL was injected.
Bioequivalence
study
Twenty
eight male volunteers aged between 18 and 50 years and index of corporal mass
within 19 and minor of 30 kg/m2 were selected for the study after assessment of
their health status by clinical evaluation (physical examination, ECG) and the
following laboratory tests: albumin, alkaline phosphatase, AST, ALT, blood
glucose, creatinine, µ-GT, total bilirubin, and total protein, trigliceride,
total cholesterol, hemoglobin, hematocrit, total and differencial white cell
counts, routine urinalysis and negative sorology for HIV, HBV and HCV. All the
subjects gave written informed consent and the Universidade São Francisco
Ethics Committee approved the clinical protocol. The study was conducted in
accordance with the provisions of the Declaration of Helsinki (1964), Tokio
(1975), Venice (1983), Hong Kong (1989), Somerset West (1996) and Edinburg
(2000) revisions.
The
volunteers possess the following clinical characteristics expressed as mean ±
SD (range): age 28.25 ± 6.03 years (18-42), height 1.73 ± 0.07 m (1.57-1.84),
body weight 71.72 ± 6.97 kg (57-87). The study was a single-dose, two-way
randomized crossover design with 13 days washout period between the doses.
During
each period, the volunteers were hospitalized at 7,5 p.m. and had a light
supper before the 10 p.m., and after an overnight fast they received (at ~7
a.m.) a single dose of paroxetine (20 mg of either formulation). Water (200 mL)
was given immediately after the drug administration and the volunteers were
then fasted for 4 h, after which period a standard lunch was served. After 7
hours was served a snack; After 12 hours, a evening meal was provided and 14
hours a supper was served. No other food was permitted during the “in-house”
period and liquid consumption was allowed ad libitum after lunch (with
the exception of xanthine-containing drinks, including tea, coffee and cola).
At 0, 2, 4, 8, 12, 24 and 36 h after the dose administration, systolic and
diastolic arterial pressure (measured non-invasively with a sphygmo-manometer),
heart rate and temperature were recorded. The hospitalar period was 36 h. The
volunteers became to the unit to supply de blood samples at 36,0; 48,0; 72,0;
96,0 and 120,0 h post-dosing. The following formulations were employed:
paroxetine (test formulation) and Aropax ® (standard reference formulation from
Glaxo SmithKline Brazil).
Blood
samples (9 mL) from a suitable antecubital vein were collected by indwelling
catheter into heparin-containing tubes at 0, 0,5; 1,0; 1,5; 2,0; 2,5; 3,0; 4,0;
4,5; 4,75; 5,0; 5,25; 5,5; 6,0; 8,0; 10,0; 12,0; 24,0; 36,0; 48,0; 72,0; 96,0
and 120,0 h post-dosing. The blood samples were centrifuged at ~2000 g for 10
minutes at room temperature and the plasma was stored at -70º until assayed for
paroxetine content.
RESULTS AND DISCUSSION
Extraction conditions
Solid-phase
extraction has been shown by Juan et al. (9) to be suitable for
simultaneous determination of paroxetine and some other nontricyclic
anti-depressants. However, a less expensive liquid-liquid extraction was found
desirable.
Different
kind of organic solvents and mixtures of solvents were used resulting in
different polarities for extractor phases. The better extraction was the one
using liquid-liquid extraction with ethyl acetate/hexane (50:50; v/v) a similar
extraction to the one described by Zhu et al (8), who have shown good
recoveries. The method was improved by replacing cyclohexane with hexane and
adding a base. Another improvement of the extraction method was the use of 1000
µL extracting solvent instead 7000µL used by Zhu which results is shorter
evaporation time. The method reported herein is an environmental fair and
cheaper method considering the amount of extracting solvent used.
The
recovery from spiked plasma samples were calculated by comparing peak areas obtained
from freshly prepared samples with those found by direct injection of
methanolic solutions at the same concentration into the LC–MS/MS system, using
the same auto-sampler). This extraction
gave the best recoveries and low
ionic suppression as has been shown in the blank, hyperlipemic and haemolised
matrix.

Figure 1: Collision induced dissociation (CID) with
nitrogen at 30 eV of energy of the MH+ ion of m/z 330.

Figure 2: a) Normal Human Plasma Normal chromatogram, lot #
42557/1
LC conditions
Paroxetine
is a compound with both polar and apolar counterparts and this characteristic
made it feasible to be handled using apolar C18 (ODS, octadecyl) stationary
phase toward a reversed-phase chromatography. Previously Naidong et al.(10)
have used a silica column with a very short run time. However, for
bioequivalence studies that require a great number of sample injections, they
used a C18 rather than the silica column.
To
enhance the throughput capability, 50 mm column with a run time of 2.6 min was
used. Previous chromatographic separation was not necessary due to the mass
spectrometric separation into the two MRM channels that select specifically
paroxetine and fluoxetine. The mobile-phase used was optimized for ionic
response of paroxetine.
Mass
Spectrometric Analysis — optimization of ESI(+)-MS/MS conditions
Among
the different possible detection techniques that can be coupled to LC, mass
spectrometry is the most suitable one for bioanalytical determinations due to
its high selectivity and sensitivity (12). MS detection in LC became feasible
in early 90’s by the emergence of the atmospheric pressure ionization
interfaces (API) such as atmospheric pressure chemical ionization (APCI) and
Electrospray ionization (ESI) that expanded the analysis of mass spectrometry
to more polar compounds including compounds of pharmacological interest (13).
In
the present work, the MS optimization was performed using direct infusion of a
metanolic solution of both paroxetine and fluoxetine (IS) into de ESI source of
the mass spectrometer and parameters such as tip (ESI), extractor, and cone
voltages were adjusted. Nebulizer and dessolvation gases were optimized to
obtain better spray shape resulting in better ionization and droplet drying to
form the protonated ionic paroxetine and fluoxetine (IS) molecules.
The
most suitable collision energy was determined by observing the response
obtained versus selectivity response for the fragment ion for each compound.
The best collision energies set were 30 eV for paroxetine and 10 eV for
fluoxetine obtaining fragments of m/z 70 and 44 from the protonated
compounds of m/z 330 (paroxetine) and m/z 310 (fluoxetine). The
selectivity of the used MRM channels were observed comparing both collision
induced dissociation mass spectrum indicating that two different routes of
fragmentation lead to different obtained fragment. Figure 1 depicts the proposed
dissociation mechanism for protonated paroxetine toward two neutral losses.
Paroxetine
protonation occurs mainly on nitrogen atom in the molecule forming MH+
ion of m/z 330. The selective dissociation occurs by tandem
4-fluorostyrene and 5-methoxy-1,3-benzodioxole loss forming a very stable
2,4-dihidropyrrolidinium cation with the positive charge at the nitrogen atom
close an double bond. Subsequently, chromatograms
were obtained using MRM mode (Multiple Reactions Monitoring) that is, selecting
parent ions dissociating them and finally analyzing the daughter selective ions
reaching great selectivity and sensitivity of this operational mode.
The
mobile phase was tested taking in account the response of the analyte toward
ionization, and after the MRM channels tunned, we changed the mobile-phase from
organic phase to more aquouse phase with acid dopant to get a fast run LC method
to enhance the throughput capability in detriment of the chromatographic
separation, and the better signal was obtained for formic acid 0.1% in
acetonitrile: water (6:4; v/v).
Validation
Selectivity
To test the selectivity of the method, four regular, one
hyperlipemic, and one haemolysed blank samples of human plasma were obtained
from six individuals and then analysed using the proposed extraction procedure
and chromatographic conditions to compare those obtained with an aqueous
solution of the analyte at a concentration near to the limit of quantification.
To test the possibility of interference, blank samples
were tested versus aqueous analyte solution using the proposed extraction
procedure and chromatographic conditions at a concentration near to the limit
of quantification. No significant
interference with the drug, metabolites or internal standard was found (Figure
2).
Figure 3 shows MRM chromatogram channels of non-zero
0.6 ng/mL paroxetine standard and IS obtained from a regular analytical run.

Figure 3: Representative MRM chromatograms of QCL: (a)
channel for paroxetine spiked human plasma containing 0.6 ng/mL (b)
channel for fluoxetine (IS).
Recovery
The
extraction efficiency of paroxetine from human plasma was determined by
analyzing the quality controls samples. The recovery in three concentrations
were determined by comparing peak areas obtained from plasma sample and those
found by direct injection of an metanolic standard solution at the same
concentration using the same conditions (Table 1).
The
recovery of paroxetine in three concentrations were determined by comparing
peak areas obtained from plasma sample and those found by direct injection of
an metanolic standard solution at the same concentration, using the same
conditions, the mean recovery of paroxetine was 78.7% (Table 1). The recovery
of IS fluoxetine tested using the method described for paroxetine was
87.34%. The observed close recoveries for the drug and IS illustrate the
suitability of the extraction procedure.
Table 1: Recovery validation data
|
|
Paroxetine |
Paroxetine |
||
|
Sample |
QCL |
QCM |
QCH |
500.0 ng/mL |
|
1 |
0.42 |
5.23 |
17.33 |
433.29 |
|
2 |
0.31 |
6.63 |
14.18 |
431.24 |
|
3 |
0.38 |
6.42 |
13.39 |
498.95 |
|
4 |
0.37 |
7.37 |
13.95 |
414.22 |
|
5 |
0.41 |
7.71 |
12.99 |
405.68 |
|
Mean
(ng/mL) |
0.38 |
6.67 |
14.37 |
436.68 |
|
CV (%) |
12.06 |
14.44 |
11.97 |
8.40 |
|
Recovery
(%) |
62.90 |
83.39 |
89.79 |
87.34 |
Nominal Concentration: QCL= 0.6
ng/mL, QCM= 8.0 ng/mL, QCH= 16.0 ng/mL
Analytical Curve and Detectability
The analytical calibration curves were constructed
with 6 non-zero standards ranging from 0.2 to 20 ng/mL. The quantification
limit (LQ) was. calculated using signal to ratio of 9 obtaining 0.1 ng/mL.
Otherwise the lowest point in the analytical curve was defined as 0.2 ng/mL due
to the better precision and accuracy.
The linear
regression analysis of paroxetine was made by plotting the peak area ratio (y)
versus the inverse of analyte concentration (1/x) in ng/mL. The linearity of the relationship between peak area and
concentration was demonstrated by the determination coefficients (r2)
obtained for the regression lines of paroxetine Precision
and accuracy of the analytical curve were < 15% relative standard deviation
(RSD). Figure 4 shows an analytical curve for paroxetine using paroxetine as
IS.
Determination of the Quality Control
Concentrations
Quality
control samples concentrations were defined using some rules. The low QC
concentration was 3 times the lowest point in the analytical curve (0.6 ng/mL),
the average QC was calculated as just about the intermediate between low QC and
high QC samples (8 ng/mL), and the high QC 80% of the highest analytical curve
point (16 ng/mL).
Intra- and Inter-Batch Validation Parameters
The
precision and accuracy of the method were evaluated by quintuplicate analyses
of three quality control samples and the lowest point in the analytical curve.
Calibration standards, the quality controls and the LQ were analyzes on three
different batches in order to determine intra- and inter-batch precision and
accuracy. The acceptance criteria for each quality control was that the coefficient
of variation (CV) and accuracy must not exceed 15% and for the LQ tolerance of
20%.
The
accuracy and intra- inter-batches of the method are shown on Table 2.
Long-Term Stability
To evaluate long-term stability, the time between the
date of the first sampling and the date of last sample analysis was used to
define the long-term period. Aliquots of each sample type were initially
frozen at -70ºC and then thawed to be extracted and tested. Then the performed
tests indicate that the analyte on human plasma can be stored at -70 ºC for at
least 73 days without showing any degradation.
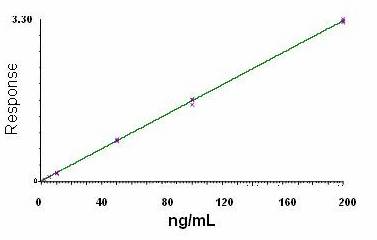
Figure 4. MRM abundances of characteristic fragment ion of paroxetine (330→70)
as a function of paroxetine in plasma concentration (fluoxetine as IS).
Table 2: Accuracy
and intra- inter-batches variability
|
Concentration (ng/mL) |
First batch (n=5) |
Second batch (n=5) |
Third batch (n=5) |
Pooled (n=15) |
||||
|
|
Accuracy (%) |
C.V. (%) |
Accuracy (%) |
C.V. (%) |
Accuracy (%) |
C.V. (%) |
Accuracy (%) |
C.V. (%) |
|
0.20 |
107.00 |
7.09 |
111.00 |
2.01 |
111.00 |
3.77 |
109.67 |
4.71 |
|
0.60 |
100.67 |
7.37 |
103.00 |
3.86 |
104.00 |
2.91 |
102.56 |
4.87 |
|
8.0 |
100.83 |
4.76 |
107.48 |
3.61 |
105.73 |
0.94 |
104.68 |
4.23 |
|
16.0 |
102.14 |
5.24 |
113.01 |
0.92 |
112.40 |
1.56 |
109.18 |
5.50 |
Application to Biological
Samples
The
proposed method was applied to the determination of paroxetine in plasma
samples for the purpose of establishing the bioequivalence of a 20 mg formulation
capsule in 28 healthy volunteers. Typical plasma concentration vs time profiles
are shown in Figure 5. Plasma concentrations of paroxetine were in the standard
curve range and remained above the 0.2 ng/mL quantitation limit for the entire
sampling period. The pharmacokinetic parameters, for the standard (reference
drug) and test (generic drug), obtained were described as follows. The value of
area under the plasma concentration vs time curve from time 0 to the last
sampling time (AUC0–t) was
209.46 ± 289.86 for the standard
and
225.04±291.91 for the test (ng.h/mL), and area under
the plasma concentration vs time curve from time 0 to time infinite (AUC∞)
was 238.19±335.97 for the standard and 246.11±316.02 (ng.h/mL) for the test.
The observed maximum plasma concentration (Cmax) that is
collect time independent was 8.23±8.08 for the standard and 9.02±8.82 for the
test (ng/mL), time to observed maximum plasma concentration (Tmax)
was 4.97±1.97 for the standard and 5.03±1.91 for the test (h), and elimination
half-life was 21.31±17.26 for the standard and 17.37±12.24 for the test (h). In
addition, the mean ratio of the plasma concentration vs time for bromopride
profile of AUC0–t divided by AUC∞ was
above 84% that is higher than the US Food and Drug Administration. These
results demonstrate that this method is simple, sensitive, reproducible and
accurate and meets the requirement of the report of the conference on
Analytical Methods Validation: Bioavailability, Bioequivalence and
Pharmacokinetic studies (11).
The last sampling time concentration (t=120h) was predicted using a one compartment open pharmacokinetic model. Therefore, in light of the present and previously reported (2,3,5) data, it is conclude that validated pharmaco-kinetic parameters can be generated using the analytical method described herein.
Figure 5. Mean plasma concentrations of test vs reference after
a 20 mg single oral dose (28 healthy volunteers).
CONCLUSIONS
A
sensitive, accurate, precise, and robust method based on LC–MS/MS has been developed for determination
of paroxetine at subnanogram level in human plasma. The method was validated to
meet the requirements of the pharmacokinetic investigation.
REFERENCES
1) Boyer, W.
F.; Feighner, J. P., an overview of Paroxetine. J Clin Psychiatry. 53:
3-6, 1992.
2) Dechant, K. L.; Clissold, S. P., paroxetine. a review of its
pharmacodynamic and pharmacokinetic properties, and therapeutic potential in
depressive illness. Drugs. 41(2):225-53, 1991.
3) Catterson,
M.L.; Preskorn, S.H., pharmacokinetics of selective serotonin reuptake
inhibitors: clinical relevance. Pharmacol Toxicol. 78(4):203-8, 1996.
4) Nemeroff, C. B.,
paroxetine: an overview of the efficacy and safety of a new selective serotonin
reuptake inhibitor in the treatment of depression. J Clin Psychopharmacol.
13:10S-17S, 1993.
5) Hiemke, C., paroxetine:
pharmacokinetics and pharmacodynamics Fortschr Neurol Psychiatr. 62
1:2-8, 1994.
6)
(a) Eap, C.B.; Bouchoux, G.;
Amey, M.; Cochard, N.; Savary, L.; Baumann, P., simultaneous determination of
human plasma levels of citalopram, paroxetine, sertraline, and their
metabolites by gas chromatography-mass spectrometry. J Chromatogr Sci.
Jul;36(7):365-71, 1998. Maurer, H.H.; Bickeboeller-Friedrich, J., screening
procedure for detection of antidepressants of the selective serotonin reuptake
inhibitor type and their metabolites in urine as part of a modified systematic
toxicological analysis procedure using gas chromatography-mass spectrometry. J
Anal Toxicol. 24(5):340-7, 2000.
7) (a) Erk, N.; Biryol,
8) (a) Zhu,
Z.; Neirinck, L., high-performance liquid chromatography-mass spectrometry
method for the determination of paroxetine in human plasma. J Chromatogr B
Analyt Technol Biomed Life Sci. 780(2):295-300, 2002.
9) Juan, H.;
Zhiling, Z.; Huande, L. simultaneous determination of fluoxetine, citalopram,
paroxetine, venlafaxine in plasma by high performance liquid
chromatography-electrospray ionization mass spectrometry (HPLC-MS/ESI). J
Chromatogr B Analyt Technol Biomed Life Sci. 820(1):33-9, 2005.
10) Naidong, W.;
Eerkes, A. development and validation of a hydrophilic interaction liquid
chromatography-tandem mass spectrometric method for the analysis of paroxetine
in human plasma. Biomed Chromatogr. 18(1):28-36, 2004.
11) (a) Federal Register Part. 320: Bioavailability
and Bioequivalence Requirements. Food and Drug Administration: Washington, DC,
1985; 154, (b) Food and Drug Administration. Pharmacopeial Fórum 1993; 19:
6501.
12) a) Chapman, J.R. Pratical Organic Mass
Spectrometry, 2a ed., 1993. b) Hoffmann, E.;
Charette, J.; Stroobant, V. Mass Spectrometry Principles and Applications.
c) Watson, J. T. Introduction to Mass Spectrometry, 3a
ed., 1997.
13) (a) Ho, E.N.; Yiu, K.C.; Wan, T.S.; Stewart, B.D.;
Watkins, K.L. detection of anti-diabetics in equine plasma and urine by liquid
chromatography-tandem mass spectrometry. J Chromatogr B Nov
5;811(1):65-73, 2004. (b) Maralikova, B.; Weinmann, W. confirmatory analysis for drugs of abuse in
plasma and urine by high-performance liquid chromatography-tandem mass
spectrometry with respect to criteria for compound identification. J
Chromatogr B 5;811(1):21-30. 2004.
(c) Taylor, P.J.; Forrest, K.K.; Landsberg, P.G.; Mitchell, C.; Pillans,
P.I. The measurement of nicotine in human plasma by high-performance liquid
chromatography-electrospray-tandem mass spectrometry Ther Drug Monit.
Oct; 26(5):563-8, 2004.
Published by the Canadian Society for Pharmaceutical Sciences.
Copyright © 1998 by the Canadian Society for Pharmaceutical Sciences.
CSPS Home | JPPS Home | Search | Subscribe to JPPS