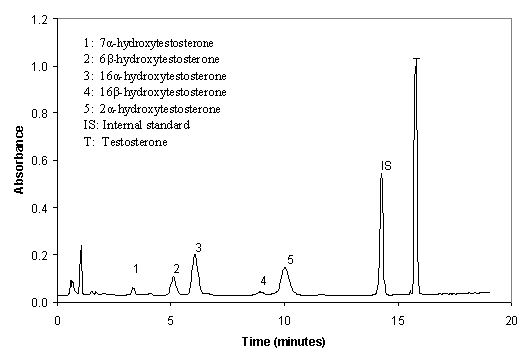
Figure 1.
Representative chromatograms for
testosterone metabolism in liver microsomes of male SD rats. Microsomal protein
(1 mg) was incubated with testosterone (250 mM) for 15 min.
J Pharm Pharmaceut Sci (www.cspscanada.org) 9(1):60-70, 2006
Effect of protein and calorie malnutrition on drug metabolism in rat - in vitro
Z. L. Mao1, Y. K. Tam2 and R. T. Coutts3
1Astellas Pharma
2Novokin
Biotech Inc., 108 Advanced Technology Centre,
3
Received 29 June 2005, Revised 5 February 2006, Accepted 6 February 2006, Published 15 February 2006
Corresponding
Author: Zhongping Lily Mao, Ph.D., Astellas Pharma
Abstract
Purpose:
To study the effect of
protein and calorie
malnutrition on in vitro drug
metabolism of protein and calorie malnourished juvenile and adult rats. Method: Microsomal incubation was used
as a means of monitoring drug metabolism changes, HPLC was employed to quantify
metabolites and enzyme immunoassay (EIA) was used for rat growth hormone (rGH)
monitoring. Results: Protein and calorie
malnutrition significantly decreased levels of microsomal protein and total
P450. Microsome of protein and calorie malnourished rats showed impaired
testosterone 16a-
and 2a- hydroxylation (CYP2C11),
testosterone 6b-hydroxylation
(CYP3A), and testosterone 7a-hydroxylation
(CYP2A1). Testosterone 16b-hydroxylation
(CYP2B1) did not show any significant change, neither in capacity nor affinity.
The quantity and the secretion pattern of rGH were not altered in protein and
calorie malnourished rats compared to those in healthy animals. Conclusions: Serum albumin is not a
good indicator of malnutrition. The
capacity and affinity of CYP2C11, CYP3A and CYP2A1 were compromised by protein
and calorie malnutrition. The
impairment of drug metabolism in protein and calorie malnourished rats was not
caused by the alteration of rGH.
The major nutritional disorder,
which occurs globally and accounts for severe morbidity and mortality, is protein
and calorie malnutrition. It was estimated
that 57 out of 100 of the children in some developing countries are affected by
malnutrition (1). As a consequence of numerous pathological
conditions, which are encountered in malnutrition, there may be a wide range of
changes in pharmacokinetic or pharmacodynamic processes of xenobiotics.
Rational
use of drugs is based on sound pharmacokinetic and pharmacodynamic principles,
and knowledge of these and the factors modifying the fate of the drug in the
body are essential for the proper management of patients. It is now recognized
that diet and nutritional status are two important variables that can alter
drug metabolism and disposition
(2-4).
The
effect of protein and calorie malnutrition on phase I metabolism is not well
characterized in literature. Most of the studies (5-9) reported in the
literature used either a very low protein or calorie protocol in this type of
studies. The pathway of drug metabolism altered by protein and calorie malnutrition
and the effects of malnutrition on various age groups are not well understood. The
objectives of this study were to determine the effect of protein and calorie
malnutrition on liver metabolic protein content and total Cytochrome P450 (P450),
and to investigate protein and calorie
malnutrition effects on enzymes such as CYP2C11, CYP3A, CYP2A1 and
CYP2B1 by using testosterone as a substrate in both juvenile and adult rats.
Effort was also made to explore the mechanism that caused the change of drug metabolism in the protein and calorie malnourished rats as this is not well investigated in literature. It was reported that growth hormone and the pituitary-thyroid axis are sensitive to protein-calorie deficit (10-12) and the constitutive male-specific CYP2C11 expression in rat liver is developmentally up-regulated at the transcriptional level by the male pattern of growth hormone (GH) secretion (12). This study was to determine whether a change in rGH secretion is a factor in diminishing drug metabolism in rats with protein and calorie malnutrition.
Testosterone, 6b-hydroxytestosterone, 16b-hydroxytestosterone, 2a-hydroxytestosterone, 7a-hydroxytestosterone, 16a-hydroxytestosterone and cortexolone were purchased from
Steraloids Inc. (
Male Sprague-Dawley (SD) rats
weighing 190-210 g (about 40 days old) were supplied by Biosciences Animal
Services,
Juvenile Rats: Male SD
rats (190-210 g, about 40 days old) were housed individually with a 12-hr
light/dark cycle at 21-22°C. The animals had access to tap water and a
nutritionally balanced Agway Prolab RMH1000 Formula ad libitum during an initial 4-day acclimation period. The feed
was weighed daily to determine the amount of food consumed by each rat. After
the acclimation period, the animals were randomly divided into two groups
(n=5/group). Group 1, the control group, had free access to food (range from
20-25 g daily) and water and Group 2, the protein and calorie malnourished
group, were fed 10 g of food
per day and had free access to water. Rats were maintained on the assigned diet
for 8 weeks.
Adult Rats: Male SD
rats (190-210 g about 40 days) were housed individually with a 12-hr light/dark
cycle at 21-22°C. The animals had access to tap water and Agway Prolab RMH1000
Formula ad libitum until the rats
were 340-360 g (about three months old). By this time, the rats reached
adulthood. The control animals had 20 g of Agway Prolab RMH1000 Formula daily
and free access to water to maintain the body weight, while Group 2 animals
were fed 12 g of Agway Prolab
RMH1000 Formula and had free access to water. The assigned diets were
maintained for 8 weeks.
Assessment of Nutrition Status: Rats were observed for general activity and alertness daily.
Serum albumin levels were measured every two weeks and weight measurement was
taken twice a week throughout the study period. For adult rats, other than
serum albumin, total plasma protein was also determined during the experimental
period.
Serum Albumin and Plasma Globulin Measurements: The
tail clip method was used for blood sampling. After rubbing the tip of the tail
with a cotton ball soaked with 75% alcohol, approximately 2 mm of the tail was
clipped using a sterilized razor blade. Immediately after 50 ml of blood were taken with a capillary tube, silver nitrate
sticks were used to stop bleeding. Blood was centrifuged for 5 min at 2,500 g
to obtain serum and samples were frozen at –20°C until analysis. Serum albumin and globulin were determined using direct
dye binding with bromocresol green. The measurement was performed by the staff
at the Surgical Medical Research Institute,
After the malnutrition treatment,
rats were subjected to jugular vein cannulation. The animals were allowed to
recover for two days. On the third day, blood samples were taken from jugular
vein at 8 am, 11 am, 2 pm and 8 pm. Serum was harvested and immediately frozen
at –20°C until rGH analysis.
An enzyme immunoassay (EIA) procedure
similar to the one by Ezan et al. (13) was employed for rGH measurement. Serum samples were
diluted in enzyme immunoassay phosphate buffer (0.1 M at pH 7.4) containing 0.15 M NaCl,
0.001 M EDTA, 0.1% BSA, 0.01% sodium azide and 0.2% Triton X-100. The 96-well
microtiter plates were coated with rabbit polyclonal antibodies specific for
goat IgG at a concentration of 10 mg/ml for one night at room temperature and saturated in the
EIA buffer without Triton X100. Before use, plates were extensively washed with
0.01 M phosphate buffer (pH 7.4) containing 0.1% Tween 20. The total 150 ml volume of the assay solution was added in 96-well
microtiter plates. Reagents were dispensed as follows: 50 ml sample or standard rGH from UCB Bioproducts calibrated
against the NIDDK standard rGH-RP2, and 50 ml rGH antiserum. After a 20 hrs incubation at room
temperature, 50 ml
enzymatic tracer (0.25 Ellman units/ml) were added before a further 20 hrs
incubation at room temperature. Plates were again washed and Ellman’s reagent
(200 ml) was distributed into each
well and incubated for 3 hrs. Absorbance was measured with a spectrophotometer
at 414 nm. All measurements for standards and samples were duplicated.
After 8 weeks of food restriction,
SD male rats were fasted overnight and anesthetized with metofane, and then the
abdominal cavity was opened for portal vein cannulation. The portal vein was
cannulated and the liver was perfused in
situ with ice-cold isotonic (1.15% w/v) potassium chloride solution for
about 3 min with a speed of 30 mL/min until the liver turned yellowish (color
of liver when blood was cleared). The liver was excised and weighed. The
following steps were performed at 4°C. The liver was finely minced and
homogenized in three volumes of ice-cold isotonic potassium chloride solution
(1.15% w/v) using a glass homogenizer equipped with a glass pestle (Glas-Col,
Cole-Parmer instrument Co., Terre Hautein, IN, USA). The homogenate was centrifuged
at 10,000 g for 30 min using a Model IEC B-20A centrifuge equipped with a No.
870 rotor (International Equipment Company,
Microsomal protein and P450 were measured
for each individual rat in both malnourished and control groups. Microsomal
protein was quantified using the
A final volume of 500 mL microsomal reaction mixture containing a 10 ml aliquot of a testosterone stock solution at substrate
concentrations of 5, 10, 20, 40, 80, 125, 250, 500, 1,000, and 2,500 mM, 5 mM MgCl2, 5 mM MnCl2, and 1 mM NADPH in 100 mM potassium
phosphate buffer (pH 7.4) was pre-incubated at 37°C for 5 min. The reaction was
initiated by adding a measured amount of microsomal protein to the mixture to
make the microsomal reaction mixture containing 1 mg/mL microsomal protein, and
carried out in air in microcentrifuge tubes (Brinkmann Instruments Inc.,
The HPLC system (Shimadzu, Tokyo,
Japan) was equipped with a LC-600 pump, a SIL-9A auto injector, a SPD-6AV UV
detector set at 247 nm and an IBM compatible PC computer system equipped with
the Baseline software program (Waters, Milford, MA, USA). The column used was
LiChrospher 60 RP-select B C8 5 mm id, 125 ´ 4 mm (Merck,
The
separation system consisted of mobile phase A (23% of acetonitrile and 77%
water) and mobile phase B (100% of acetonitrile). A gradient system started
with 100% of A. Between 8-18 min, mobile phase B was programmed to increase
linearly from 0 to 100% and the proportion of B was reduced linearly to 0 from
18-22 min. This condition was held for two minutes for equilibration. The flow
rate used was 2 mL/min.
The separation of testosterone and its metabolites produced in a rat liver microsome preparation is shown in Figure 1. The results demonstrate further that there was no baseline interference associated with microsomal incubation and the chromatographic run time was shorter. All recovery rates of testosterone and its metabolites at incubate concentrations of 0.2 and 5 nmol/ml were greater than 95%. The linearity of the method was established over the concentration range 0.2-5 nmol/ml for testosterone and its metabolites. Correlation coefficients were greater than 0.99 for all the compounds measured.
Figure 1.
Representative chromatograms for
testosterone metabolism in liver microsomes of male SD rats. Microsomal protein
(1 mg) was incubated with testosterone (250 mM) for 15 min.
The Lineweaver-Burke plot method (16) was used to estimate the kinetic constants (Km and
Vmax) for the disappearance of testosterone for each individual rat. Mean and standard
deviation (SD) were calculated from the parameters of the individual rat in the
malnourished or control groups.
Student t-test was used to analyze all the parameters measured in protein and calorie malnourished and control rats. The level of statistical significance of the parameters between the experimental and control groups was identified using the ANOVA analysis. A value of P<0.05 was considered statistically significant. Data are expressed as mean ± SD, unless stated otherwise.
After 8 weeks of food restriction in juvenile and adult rats, weight loss, emaciation, loss of turgor in the skin, almost total disappearance of subcutaneous fat and atrophy of the muscles were observed in the food restricted groups. These symptoms are typical for protein and calorie malnutrition and it suggested that 8-week of food restriction induced protein and calorie malnutrition in both juvenile and adult rats. Since the diets for malnourished groups were about 40% to 60% of the control groups, the malnourished groups did not suffer from acute protein malnutrition. The malnourished conditions created in this study would rather be a mimic of the real life situation where the subjects are partially restricted in protein and calorie intake.
The physical and microsomal parameters of
the malnourished and control juvenile rats are summarized on
Table 1. Serum albumin levels of juvenile rats were similar in both
experimental and control group after the 8 weeks of food restriction (P>0.05).
However, the body weight, and liver weight of juvenile rats decreased to about
50% of the control values, and microsomal protein and total P450 per gram of
liver decreased to about 60% of the control. The parameters derived from the
testosterone metabolism in liver microsomes are summarized on
Table 2. Mean and
SD values were calculated from the parameters of each individual rat of the
malnourished or control groups. Except for
16b-testosterone hydroxylation, the Vmax values
of the other four hydroxylation pathways decreased significantly in protein and
calorie malnourished juvenile animals compared to those of control, while the Km
values of these enzymes increased significantly. The results indicate that the
isozyme (CYP2C11) for catalyzing 2a-hydroxylation of testosterone has a
large capacity and the catalyzing capacity was impaired by protein and calorie malnutrition.
Table 1.
Physical and
microsomal parameters in protein and calorie malnourished juvenile rats after 8
weeks of food restriction.
|
Parameters |
Control |
Malnourished |
|
Body weight (g) |
470
± 10 |
230
± 14* |
|
Liver weight (g) |
16.9
± 0.5 |
7.9
± 0.9* |
|
Serum Albumin (g/L) |
35.3
± 3.9 |
34.0
± 2.5 |
|
Microsomal Protein (mg/g liver) |
43.5
± 2.5 |
25.8
± 2.6* |
|
Total P450 (nmol/g liver) |
24.1
± 3.6 |
14.3
± 3.0* |
*P < 0.05 compared with controls. Values are reported as mean ± SD.
Table 2.
Mean
(±
SD) Michaelis-Menten parameters of testosterone metabolism in liver microsomes of juvenile rats
|
Pathways |
Vmax
(pmol/min/mg) |
Km
(mM) |
||
|
Control |
Malnourished (n=5) |
Control |
Malnourished |
|
|
16b-hydroxylation |
63.4
± 6.3 |
59.1
± 5.2 |
38.9
± 3.3 |
39.4
± 4.3 |
|
7a-hydroxylation |
348.4
± 35.1 |
196.4
± 25.5* |
9.1
± 0.76 |
16.1
± 2.7* |
|
2a-hydroxylation |
5363
± 525 |
2439
± 225* |
15.1
± 1.7 |
22.7
± 2.3* |
|
16a-hydroxylation |
3448
± 345 |
1538
± 165* |
10.3
± 1.8 |
26.6
± 2.1* |
|
6b-hydroxylation |
833
± 75 |
322
± 35* |
13.5
± 1.1 |
26.3
± 2.3* |
*P < 0.05 compared with controls. Values are reported as mean ± SD.
Table 3.
Physical and microsomal parameters in protein and calorie
malnourished Adult rats after 8 weeks of food restriction
|
Parameters |
Control |
Malnourished |
|
Body weight (g) |
445
± 27 |
267
± 10* |
|
Liver weight (g) |
13.9
± 1.9 |
8.1
± 0.4* |
|
Serum albumin (g/L) |
34.5
± 2.1 |
34.0
± 4.8 |
|
Total plasma protein (g/L) |
66.1
± 8.6 |
65.5
± 10.1 |
|
Microsomal Protein (mg/g liver) |
40.1
± 4.1 |
27.6
± 3.2* |
|
P450 liver (nmol/g liver) |
23.2
± 2.8 |
15.8
± 2.2* |
*P < 0.05 compared with controls. Values are reported as mean ± SD.
The physical and microsomal
parameters of the malnourished and control adult rats are summarized on
Table
3. After 8 weeks of food restriction, body weight of the malnourished adult rats
was about 60% of the controls. Their liver weight decreased proportionally to
the body weight and the liver weight of the malnourished ones was also about
60% of the control. The decrease of liver weight was not as dramatic as that in
juvenile rats (40% decrease in protein and calorie malnourished adult rats
while 50% decrease in protein and calorie malnourished juvenile rats). In
addition to serum albumin, total plasma protein level was monitored in protein
and calorie malnourished adult rats. No differences in the serum albumin and
total plasma protein levels were found between the control and the malnourished
rats. The lack of change in the plasma protein levels suggests that these
parameters are not good indicators of malnutrition in drug metabolism studies. Changes in parameters such as total P450, microsomal
protein and capacity and affinity of major enzymes better reflect a change in
nutritional status.
Table
3 also shows that microsomal protein in adult
malnourished rats is significantly lower than that of controls, but the
decrease was not as significant as that observed in juvenile rats. Total P450
in adult malnourished rats was also significantly lower; it was about 70% of
that of the control. Compared to the juvenile study in which total P450 was
less than 60% of that of the controls, the impairment is not as severe in the
malnourished adult rats.
Table 4.
Mean
(± SD) Michaelis-Menten parameters of
testosterone metabolism in liver microsomes of adult rats after 8 weeks of food
restriction
|
Pathways |
Vmax
(pmol/min/mg) |
Km
(mM) |
||
|
Control
|
Malnourished |
Control
|
Malnourished |
|
|
16b-hydroxylation |
65.4
± 10.1 |
58.3
± 7.2 |
35.3
± 4.3 |
36.5
± 5.0 |
|
7a-hydroxylation |
396.8
± 34.2 |
217.4
± 24.3* |
10.2
± 2.4 |
17.4
± 2.7* |
|
2a-hydroxylation |
5263
± 511 |
2941
± 289* |
16.7
± 2.7 |
23.7
± 3.1* |
|
16a-hydroxylation
|
2941
± 299 |
1960
± 210* |
11.1
± 2.7 |
22.5
± 2.7* |
|
6b-hydroxylation |
753
± 66 |
414
± 46* |
15.2
± 1.7 |
27.3
± 2.7* |
*P < 0.05 compared with controls. Values are reported as mean ± SD.
Table 4
summarized the values of Vmax and Km
of 16a-, 2a-, 7a-,
6b- and 16b- hydroxylation of testosterone metabolism pathways in protein
and calorie malnourished adult rats. Except
for 16b- hydroxylation, the Vmax
values of 16a-, 2a-, 7a-
and 6b- testosterone hydroxylation
were found to be significantly lower in the malnourished group than those in
the controls. Compared to the Vmax values of those in juvenile rats, the decrease of Vmax values of 16a-, 2a-,
7a-, 6b-hydroxylation in adult rats was not as dramatic, while the
Vmax of 16b-hydroxylation
did decrease, but not significantly. The
impairment of the catalyzing capacity caused by protein and calorie
malnutrition is evident though the change is less than that in juvenile rats.
The Km values of 16a-, 2a-,
7a- and 6b-hydroxylation increased
significantly. The changes were similar to those observed in the juvenile rats.
The Km of 16b-hydroxylation in adult
rats did not show a significant change. A similar observation was made
in the juvenile study. The results demonstrate
that protein and calorie malnutrition
impaired the capacities and affinities of CYP2C11, 3A and 2A1 in protein and
calorie malnourished rats, whereas CYP2B1 did not show any significant
difference both in capacity and affinity under protein and calorie malnourished
condition. The impairment of the enzyme capacities in juvenile rats was more
severe than that in adult rats.
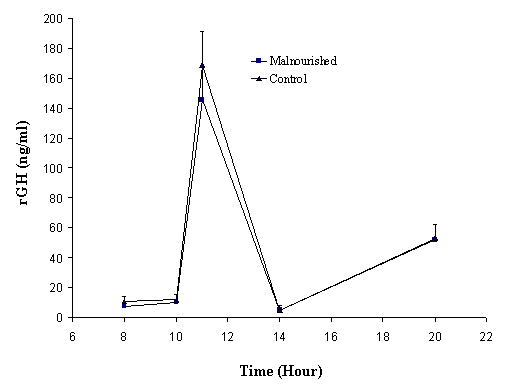
Figure 2. Circadian rhythmicity of rGH (mean ± SD) in juvenile control and protein and calorie malnourished rats after two months of food restriction (n=5/group).
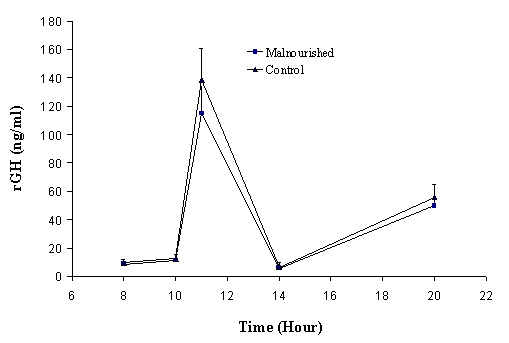
Figure
3.
Circadian rhythmicity of rGH (mean ± SD)
in adult control and malnourished rats after two months of food restriction
(n=6/group).
Figures 2 and
3 illustrate the
change of rGH levels in malnourished and controlled groups for juvenile and
adult rats, respectively. Blood samples were obtained at the last day of
treatment. The rGH values are expressed as Mean ± SD. Blood samples were taken
at 8 am, 11 am, 2 pm and 8 pm, as according to the literature, these are the
peak and trough times for rGH secretion (17). The rGH levels fluctuate during the day and have
peak values at around
The
results show that the secretion of rGH at peak and trough times was not
significantly different between experimental and control groups in either
juvenile or adult studies. The secretion pattern, as well as the concentrations
of rGH in serum, was very similar in protein and calorie malnourished and
control groups of juvenile and adult rats.
At the time when rGH was measured, the juvenile rats were already older than 3 months (40 days + 2 months of food control), which were in the adult rat range. At this age, it is not surprising that the rGH plateau values in the juvenile rats were not significantly different from that of the adult rats. The values of rGH reported in literature vary from study to study; data in this study are comparable with the values reported by Moberg et al (15).
The formation of 2a-hydroxytestosterone and 16a-hydroxytestosterone are catalyzed by
CYP2C11 (18) and 6b-hydroxytestosterone
formation is catalyzed by CYP3A, 7a-hydroxytestosterone formation is
catalyzed by CYP2A1, while 16b-hydroxytestosterone formation is
catalyzed by CYP2B1 (19). These results suggest that both the capacity and affinity of CYP2C11,
CYP2A1, and CYP3A were impaired in protein and calorie malnourished rats while
CYP2B1 did not show any significant difference in activity. The results of this study are consistent with those
reported in the literature. A decrease in the levels of liver DNA together with
a reduction of microsomal proteins, P450, P450 reductase, and several other
microsomal enzymes in protein malnourished juvenile
rats have been reported (5, 20-22). These studies also
showed a decrease in CYP activity under the malnourished conditions. Bulusu and
Chakravarty (23) showed that three
weeks of protein deprivation (3 or 6 % protein intake) caused significant
reductions in the aniline hydroxylase and aminopyrine (substrates for CYP2C and
CYP3A) demethylase activities. From the results of this study, it seems that
serum albumin level is not a good indicator of malnutrition for drug metabolism
studies.
As after 8 weeks of food restriction in juvenile
and adult rats, the symptoms of protein
and calorie malnutrition (weight loss,
emaciation, loss of turgor in the skin, almost total disappearance of
subcutaneous fat and atrophy of the muscles) were observed, while serum
albumin was virtually unchanged. This is interesting since conventionally,
serum albumin has been set as a criterion for the evaluation of animal
malnutrition (6,
24).
However, this condition would only happen when the
subject is suffered from kwashiorkor, an acute form of protein malnutrition. Kwashiorkor manifests as inadequate growth of juvenile
subjects, loss of muscular tissue, edema and hepatomegaly. For kwashiorkor
subjects, low serum albumin is often observed (25). The form of malnutrition that has been induced in this study is similar
to a form of severe malnutrition, namely marasmus. Marasmus is a chronic
inanition and is characterized by weight loss, emaciation, loss of turgor in
the skin, almost total disappearance of subcutaneous fat and atrophy of the
muscles. Serum albumin concentrations may or may not change under this
condition. In our study, the animals did not suffer from acute protein
malnutrition since the restricted diet contained 17.6% protein. Weight loss,
emaciation, almost total disappearance of subcutaneous fat and atrophy of the
muscles were observed while low serum albumin, edema and hepatomegaly were not
present. The lack of edema in the protein and calorie malnourished animals is a
distinctive characteristic of marasmus (3).
CYP2C11 is a
major isoenzyme in the liver of male rats. This isoenzyme accounts for about
one third of the total cytochrome P450 in SD male rat liver and it metabolizes
a host of xenobiotics such as benzphetamine, aminopyrine, ethylmorphine,
benzopyrene and warfarin (18). Furthermore, rat
CYP2C11 shares most substrates for metabolism with human CYP3A4 (26). Human CYP3A4 is a
major isoenzyme in human liver; this single isoenzyme is involved in about 60%
of all oxidations of clinically used drugs, including erythromycin, nifedipine,
testosterone,
and lidocaine (27).
In addition to CYP2C11, the activities of CYP3A and CYP2A1 are also impaired by malnutrition. The metabolism of antipyrine, a CYP2B1 substrate in rat (28, 29), has been contradictory in malnourished studies (30-32. Interestingly, CYP2B1 did not show a significant change in this study.
In the
literature, the effect of malnutrition on drug metabolism was studied under
different nutritional conditions and the results were conflicting. Anthony (5) reported that protein malnutrition (malnourished
groups were fed with food containing 0.5% or 1% protein while control groups
were fed with food containing 18% protein) severely impaired drug metabolism.
Leakey’s (7) group reported that caloric restriction (with 60% of
the amount of food consumed by the control group) decreased the age-related
changes in hepatic testosterone metabolism (improved drug metabolism). Catz (6) found that in neonatal animals with moderate
malnutrition, the difference in the rate of metabolism was not uniform. For
oxidative pathways, an increase was found using aminopyrine and benzpyrene as
substrates, suggesting CYP2C11 activity was elevated. However, the rate of
aniline, a substrate for CYP2E1 metabolism was not altered. For reductive
pathways, a decrease was observed with two substrates: p-nitrobenzoic acid and
neoprontosil. The results of these studies indicate that malnutrition has
different impact on drug metabolism in rats; however, the effect of the changes
was not studied in detail.
The novelty of
this study is the investigation of drug metabolism changes under the influence
of protein and calorie malnutrition. This is different from protein-calorie
malnutrition, in that the only nutritional deficiency is protein (5, 8, 9). The condition which is being mimicked here is
chronic malnutrition, similar to that observed globally (1). The
symptoms observed in malnourished rats in this study are consistent with that
of marasmus. It is characterized by weight loss, emaciation, almost total
disappearance of subcutaneous fat and atrophy of the muscles.
Malnutrition
started at different stages of life has different effects on drug metabolism as
shown in this study. In comparison of the
results from the juvenile rats to those from the adult rats, the effect of
malnutrition was more severe in the juvenile rats. The juvenile rats
were in “juvenile” stage when the food restriction began. In juvenile stage, protein synthesis is more
sensitive to environmental changes, the immune system is more fragile to
foreign insults, and consequently the degree of protein and enzyme reduction is
more severe in juvenile protein and calorie malnourished rats (7). Since similar
results were observed from both protein and calorie malnourished juvenile rats
and protein and calorie malnourished adult rat, age does not seem to play a
significant role in producing contradictory results. However, the type of
malnutrition may be a major contributing factor. Most of the metabolism studies
involving malnutrition focused on protein malnutrition and no studies have been
conducted in protein and calorie malnutrition. More studies are required to
evaluate the effects of various forms of nutrition deprivation on drug
metabolism.
Some researchers reported a decrease of rGH in malnourished rats. According to the report of Armario et al. (33), food restriction changed the profile of rGH secretion. Rats that had food ad libitum showed a rGH secretion profile that fluctuated during the day and had peak values around 11 am and 8 pm and troughs around 2 pm and 2 am, while the profile for the food-restricted rats (65% of the control) was a flat line. Dickerman’s group also made a similar observation with starved rats (34). Nevertheless, the study carried out by Moberg et al. (17) showed that the effects of food restriction on rGH levels were slight and transient. After 3 days of food restriction, the plasma levels of rGH were markedly depressed when compared to those of the control SD male rats. After 14 days of food restriction, the daily pattern of plasma GH levels were still depressed, but showed a trend of recovery. After 6 weeks of food restriction, the profile of daily plasma GH rhythm was essentially the same as that for the ad libitum fed controls. The depressed levels of GH in the 3-day and 14-day groups may be the result of adapting to the new feeding regimen since various stresses have been reported to suppress GH levels (35-39).
The discrepancy
between our observation and those in the literature could be associated with
the ages of the animal used and with the duration and degree of food
restriction. In Armario’s study (33), about 30 day old male SD rats were used. At this
age, GH secretion might be very sensitive to environmental stress, like food
restriction. After 30 days of food restriction, the animals had not yet adapted
to the stress. In Dicherman’s study (34), SD male rats were starved for 7 days. The animals
had to adapt to the dramatic environmental change, and many physical parameters
such as rGH changed to balance the alteration. In some dramatic or short time
stress situations, animals are not able to accommodate to the aversive
situation, so alteration of rGH is observed. In our study, after two months of
food restriction, rats could have already adapted to the stress and the rGH
level returned to normal.
Another
parameter that should be considered is serum albumin. Researchers (40, 41 observed an inverse
relationship of GH with serum albumin levels. They suggested that low serum
albumin might act as a stimulus for the alteration of growth hormone levels. In
our study, serum albumin was in the normal range, so it is not surprising that
we did not see a change in rGH.
From this study, it is concluded that protein and calorie malnutrition decreases microsomal protein and total P450 levels in both juvenile and adult rats. Protein and calorie malnutrition impairs the abilities of CYP2C11, CYP3A, and CYP2A1 to hydrolyze testosterone. CYP2B1 activity did not show any significant change either in capacity or affinity in protein and calorie malnourished juvenile and in protein and calorie malnourished adult rats. Changes in protein and calorie malnourished adult rats were not as dramatic as those in juvenile rats. Neither serum albumin nor total plasma protein level is a good indicator of malnutrition. The impairment of drug metabolism in protein and calorie malnourished rats was not caused by the alteration of rGH. The quantity and the secretion pattern of rGH were not altered in protein and calorie malnourished rats compared to those in healthy animals. The mechanisms that caused the impairment of drug metabolism in malnourished subjects require further investigation.
This work was supported by Medical Research Council of
Canada. The authors appreciate Dr. Grouselle’s lab in
[1]
El-Ghannam A.R., The global problems of
child malnutrition and mortality in different world regions. J Health Soc Policy., 16(4): 1-26., 2003
[2]
Conney
A.H.; Buening M.K.; Pantuck E.J., et al., Regulation of human drug metabolism
by dietary factors. Ciba Foundation
Symposium, 76: 147-167, 1980
[3]
Krishnaswamy
K., Nutrition and drug metabolism. Indian
J Med Res, 68 Suppl: 109-120, 1978
[4]
Krishnaswamy
K. and Polasa K., Diet, nutrition & cancer--the Indian scenario. [Review]
[70 refs]. Indian J Med Res, 102:
200-209, 1995
[5]
Anthony
L.E., Effects of protein-calorie malnutrition on drug metabolism in rat liver
microsomes. J Nutr, 103(6): 811-820,
1973
[6]
Catz
C.S., Malnutrition and drug metabolism in fetal and neonatal animals. Developmental Pharmacology &
Therapeutics, 15(3-4): 211-214, 1990
[7]
Leakey
J.E.; Cunny H.C.; Bazare J., Jr, et al., Effects of aging and caloric
restriction on hepatic drug metabolizing enzymes in the Fischer 344 rat. I: The
cytochrome P-450 dependent monooxygenase system. [Review] [53 refs]. Mechanisms of Ageing & Development,
48(2): 145-155, 1989
[8]
Ahn
C.Y.; Kim E.J.; Kwon J.W., et al., Effects of cysteine on the pharmacokinetics
of intravenous clarithromycin in rats with protein-calorie malnutrition. Life Sci, 73(14): 1783-94., 2003
[9]
Bae
S.K.; Lee D.Y.; Lee A.K., et al., Effects of cysteine on the pharmacokinetics
of intravenous torasemide in rats with protein-calorie malnutrition. J Pharm Sci, 93(9): 2388-98., 2004
[10]
Becker
D.J., The endocrine responses to protein calorie malnutrition. [Review] [229
refs]. Annu Rev Nutr, 3: 187-212,
1983
[11]
Brasel
J.A., Endocrine adaptation to malnutrition. Pediatr
Res, 14(12): 1299-1303, 1980
[12]
Ortiz-Caro
J.; Gonzalez C. and Jolin T., Diurnal variations of plasma growth hormone,
thyrotropin, thyroxine, and triiodothyronine in streptozotocin-diabetic and
food-restricted rats. Endocrinology,
115(6): 2227-2232, 1984
[13]
Ezan
E.; Laplante E.; Bluet-Pajot M.T., et al., An enzyme immunoassay for rat growth
hormone: validation and application to the determination of plasma levels and
in vitro release. J Immunoassay,
18(4): 335-356, 1997
[14]
Bradford
M.M., A rapid and sensitive method for the quantitation of microgram quantities
of protein utilizing the principle of protein-dye binding. Anal Biochem, 72: 248-254, 1976
[15]
Omura
T. and Sato R., The Carbon Monoxide-binding Pigment of Liver Microsomes I
evidence for its hemoprotein nature. J
Biol Chem, 239(7): 2370-2378, 1964
[16]
Lineweaver
H. and Burke D., The determination of enzyme dissociation constants. J Am Chem Soc, 56: 658-66, 1934
[17]
Moberg
G.P.; Bellinger L.L. and Mendel V.E., Effect of meal feeding on daily rhythms
of plasma corticosterone and growth hormone in the rat. Neuroendocrinology, 19(2): 160-169, 1975
[18]
Chen
G.F.; Ronis M.J.; Thomas P.E.; Flint D.J. and Badger T.M., Hormonal regulation
of microsomal cytochrome P450 2C11 in rat liver and kidney. J Pharmacology & Experimental
Therapeutics, 283(3): 1486-1494, 1997
[19]
Sanwald
P.; Blankson E.A.; Dulery B.D.; Schoun J.; Huebert N.D. and Dow J., Isocratic
high-performance liquid chromatographic method for the separation of
testosterone metabolites. J Chromatogr B,
672(2): 207-215, 1995
[20]
Campbell
T.C. and Hayes J.R., Role of nutrition in the drug-metabolizing enzyme system.
[Review] [232 refs]. Pharmacol Rev,
26(3): 171-197, 1974
[21]
Hayes
J.R.; Mgbodile M.U. and Campbell T.C., Effect of protein deficiency on the
inducibility of the hepatic microsomal drug-metabolizing enzyme system. I.
Effect on substrate interaction with cytochrome P-450. Biochem Pharmacol, 22(9): 1005-1014, 1973
[22]
Mgbodile
M.U. and Campbell T.C., Effect of protein deprivation of male weanling rats on
the kinetics of hepatic microsomal enzyme activity. J Nutr, 102(1): 53-60, 1972
[23]
Bulusu
S. and Chakravarty I., Profile of drug metabolizing enzymes in rats treated
with parathion, malathion, and phosalone under various conditions of protein
energy malnutrition. Bull Environ Contam
Toxicol, 40(1): 110-118, 1988
[24]
Omoike
I.; Lindquist B.; Abud R.; Merrick J. and Lebenthal E., The effect of
protein-energy malnutrition and refeeding on the adherence of Salmonella
typhimurium to small intestinal mucosa and isolated enterocytes in rats. J Nutr, 120(4): 404-411, 1990
[25]
Chandra
R.K., Protein-energy malnutrition and immunological responses. J Nutr, 122(3 Suppl): 597-600, 1992
[26]
Smith
D.A., Species differences in metabolism and pharmacokinetics: are we close to
an understanding?. [Review] [68 refs]. Drug
Metab Rev, 23(3-4): 355-373, 1991
[27]
Dresser
G.K.; Spence J.D. and Bailey D.G., Pharmacokinetic-pharmacodynamic consequences
and clinical relevance of cytochrome P450 3A4 inhibition. [Review] [162 refs]. Clin Pharmacokinet, 38(1): 41-57, 2000
[28]
Gorenkov
R.V.; Liubchenko P.N.; Bendikov E.A.; Potapova V.B.; Petrakov A.V. and Ul,
Antipyrine metabolism and rat liver ultrastructure in single and combined
action of trichlorodiphenyl and dioctyl phthalate [Russian]. Biulleten Eksperimentalnoi Biologii i
Meditsiny, 113(3): 285-288, 1992
[29]
Inaba
T.; Lucassen M. and Kalow W., Antipyrine metabolism in the rat by three hepatic
monooxygenases. Life Sci, 26(23):
1977-1983, 1980
[30]
Homeida
M.; Karrar Z.A. and Roberts C.J., Drug metabolism in malnourished children: a
study with antipyrine. Arch Dis Child,
54(4): 299-302, 1979
[31]
Krishnaswamy
K. and Naidu A.N., Microsomal enzymes in malnutrition as determined by plasma
half life of antipyrine. British Med J,
1(6060): 538-540, 1977
[32]
Narang
R.K.; Mehta S. and Mathur V.S., Pharmacokinetic study of antipyrine in
malnourished children. Am J Clin Nutr,
30(12): 1979-1982, 1977
[33]
Armario
A.; Montero J.L. and Jolin T., Chronic food restriction and the circadian
rhythms of pituitary-adrenal hormones, growth hormone and thyroid-stimulating
hormone. Ann Nutr Metab, 31(2):
81-87, 1987
[34]
Dickerman
E.; Negro-Vilar A. and Meites J., Effects of starvation on plasma GH activity,
pituitary GH and GH-RF levels in the rat. Endocrinology,
84(4): 814-819, 1969
[35]
Dunn
J.; Scheving L. and Millet P., Circadian variation in stress-evoked increases
in plasma corticosterone. Am J Physiol,
223(2): 402-406, 1972
[36]
Brown
G.M. and Reichlin S., Psychologic and neural regulation of growth hormone
secretion. [Review] [196 refs]. Psychosom
Med, 34(1): 45-61, 1972
[37]
Brown
G.M.; Schalch D.S. and Reichlin S., Patterns of growth hormone and cortisol
responses to psychological stress in the squirrel monkey. Endocrinology, 88(4): 956-963, 1971
[38]
Schalch
D.S., The influence of physical stress and exercise on growth hormone and
insulin secretion in man. J Lab &
Clin Med, 69(2): 256-269, 1967
[39]
Cronin
M.T.; Siegel B.J. and Moberg G.P., Effect of behavioral stress on plasma levels
of growth hormone in sheep. Physiol Behav,
26(5): 887-890, 1981
[40]
Pimstone
B.L. and Hansen J.D., Adaptation to low-protein intakes. Lancet, 1(7585): 105, 1969
[41] Kajubi S.K. and Okel R.M., Letters to the editor: Serum insulin and growth hormone after kwashiorkor. Am J Clin Nutr, 27(11): 1200-1201, 1974
Published by the Canadian Society for Pharmaceutical Sciences.
Copyright © 1998 by the Canadian Society for Pharmaceutical Sciences.
CSPS Home | JPPS Home | Search | Subscribe to JPPS