While at the theater, we notice there were definite times in which the
lobby of the theater was empty. It was at this time the employees cleaned
the immediate areas and prepared themselves for the next rush of people.
The following line graph depicts the number of movies which would be starting
between time spans of 15 minutes. This affects the number of people loitering
around, playing arcade games, and buying refreshments.

C. A.'s comment: What was the relevance of analyzing the flow of people to an analysis of the profitability of opening a theatre on Sunday?
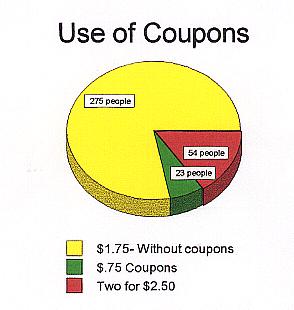
The following Circle Graphs represent the number of people who paid an entrance fee into the theater. An overwhelming majority paid full price, although coupons were used. There were two types of valid coupons which were utilized, one of which lowered the fee to $.75 per person. The second type was "2 for $2.50", in which two people could enter by paying only $2.50, actually paying $1.25 per person. The regular fee for Matinees is $1.75 per person.


The total amount of money made at concession was 505.41 dollars.
170 people visited the concession spending an average of 2.97
dollars at the concession stand.
This is not taking in to account the amount it costs them to buy the
popcorn or candy or drinks.
Candy
Popcorn kernels (bought in bulk from the US)
Drink syrup
Machines to make the popcorn and drinks
Drink cups and popcorn bags
Cash registers
Uniforms for the concession workers
Napkins
cleaning supplies
C. A. comment: Classifying the fixed costs and variable costs in order to look at the gross profit margin and net profit margin
| NAME OF GAME | MONEY MADE | COST TO PLAY |
| Star Trek | $8.00 | $1.00 |
| Black Lagoon | $7.00 | $1.00 |
| Max TT | $4.00 | $1.00 |
| Marvel | $2.50 | $0.50 |
| Gunblader | $1.00 | $1.00 |
| Evil Night | 0 | $1.00 |
| Virtual Racing | $0.50 | $0.50 |
| Simpsons | $0.75 | $0.25 |
| Neo Geo | $0.25 | $0.25 |
| Wrestler Mania | $0.50 | $0.50 |
| Police Trainer | $2.50 | $0.50 |
| Area 5 | $0.50 | $0.50 |
| Super Mario | $2.75 | $0.25 |
| Virtua Cops | $1.50 | $0.50 |
| Virtua Races | $0.50 | $0.50 |
| Super GT | $7.00 | $1.00 |
Top three highest money makers
Star Trek Pinball
Black Lagoon Pinball
Super GT Racer
Top three lowest money makers
Evil Night
Virtual Racing
Neo Geo/Wrestler Mania
C. A.'s comment: Looking at areas that have a positive gross margin, the main areas where I do business
C.A.'s comment: Looking at the analysis from a broad persective
What overall profit does the theatre receive from its arcade games monthly? Weekly?
How many customers would they need to average on a Friday night in order to make a profit?
What is the cost of running, renting or leasing the building in which the theatre is being run?
Compare the concession food prices to those prices of your local supermarket.
C. A.'s comment: Other possible projects for a break-even analysis
General Conclusions
During our time there the arcade games made approximately $40.00
There were sixteen different machines ranging from $0.25 to $1.00 cost to play
There were 58 different times when a person played a game. 37 of these games were played before ten to two, before the next show.
64% of the people played before the show
37% played a game afterwards
The games that cost more money to play were the most popular
Pinball machines were most popular
Conclusions Made from Pie Graph
The top three highest money makers made a total of $22.00. This total was higher than the money earned by all 13 other games.
The arcade games made an average of $2.50 each.
The most worthwhile game was Star Trek, while the least profitable was Evil Night.
Star Trek: $8.00
Evil Night: $0.00
The arcade machines were supplied by an amusement company, the theatre share there profits with the company.
Repair costs for the games
Additional cost of renting or leasing
EXTRA FINANCIAL CONSIDERATIONS
Cost of renting or leasing arcade games
Cost of repairing arcade games and other machines
Portion of profit made off of Arcade games
Cost of advertising (newspaper ex.)
Cost of concession stand foods
possible additional hirering cost
overall cost of employees
uniforms
storage area
shipment of material
cost of coupons
cost of film supply
cost of film machinery
possible cleaning staff
possible legal rights
Workers
There were 11 people working at the theater the day we visited.
1 manager x $7.00 an hour
2 upstairs working projectors, 2 box office, 2 ushers,
4 concession x $6.00 an hour
3hoursx6.OOx 10
3 hours x 7.00
$210 dollars for workers.
C. A.'s comment: Did they do a hard-nosed analysis at the end of the day? Was there a real structure for determining profitability in this project?
Suggestions
1. Have all your data sheets and recording material well organized. Have extra sheets just in case there is a rush of people and you run out of space.
2. Be specific in what you're trying to achieve and focus on it.
3. Be friendly to workers or staff, they are allowing you to perform your project in their building.
4. Be sure not to disturb customers.
5. Plan ahead before you go.
6. Have fun!!!
Suggestions
Make sure to have all materials ready before collecting your data, make sure to consider all road blocks before hand in order to avoid problems.
Be specific in what you are trying to achieve, (what do you especially want to find out?)
Be friendly to all staff members (After all they are allowing you to use their establishment in order to conduct your experiment)
Don't bother customers, try to work as discretely as possible.
Have fun!
