Lecture 16: Stellar Structure and Evolution


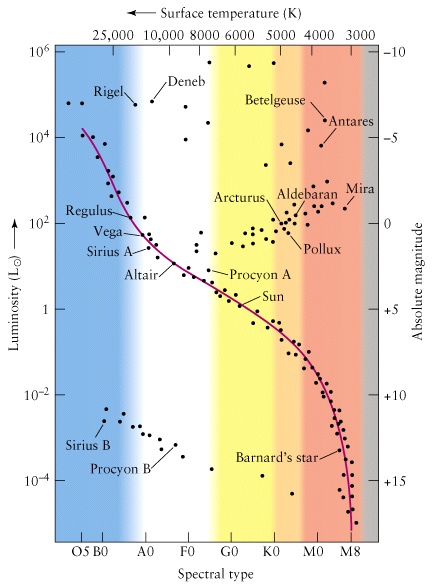
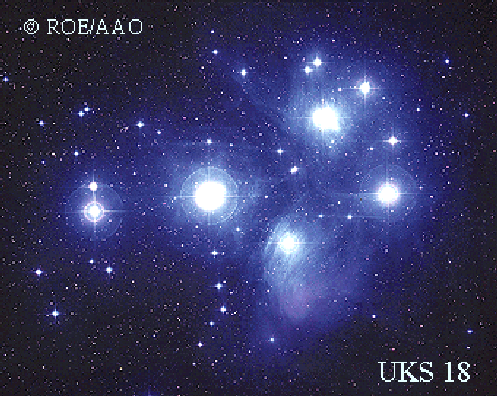
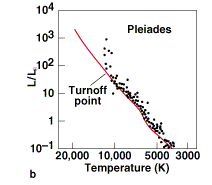
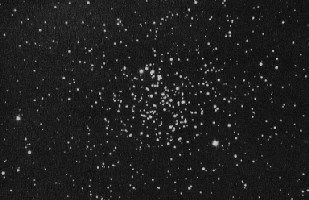
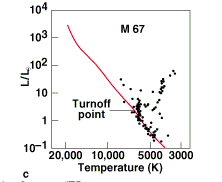
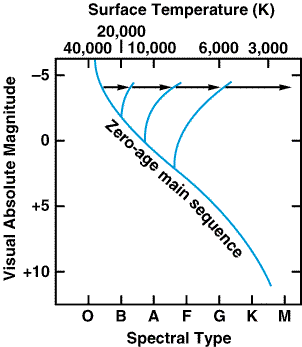
Birth of Main sequence

  • The Composition of the interstellar medium is fairly uniform in composition about 73% H, 25% He.
  • The stars which form out of the interstellar gas clouds should also have fairly uniform composition.
  • Since H is most common element in the young star, the most likely reaction which could power the star is the nuclear fusion reaction 4 H -> 4He.
  • The only feature which changes from the formation of one star to another is the mass of the collapsing cloud.
  • This suggests that main sequence stars are formed from clouds that differ primarlily in mass

M &xi(M) =
number of stars in each decade of masses
Salpeter Law: &xi(M) ~ (M/MSun)-1.35


The Main Sequence

  • When we look at different stars in the sky, we find that about 90% of all stars fall on the Main Sequence.
  • Most likely explanation is that Main Sequence stars are constantly being born, and that they have very long life spans.
  • Other stars, such as red giants are more rare than main sequence stars, so their life spans should be shorter.
  • Goal of the theory of the main sequence is to explain the dependence of luminosity on temperature L(T) that is observed along the main sequence. We have to explain, really L(M) and T(M)

A Hertzsprung-Russell Diagram showing the Main Sequence

Figure 19-14


The Masses of Main Sequence Stars

  • If we observe main sequence stars in binary systems, we can find the stars' masses.
  • For main sequence stars we find that more massive stars are more luminous than less massive stars.
  • Main Sequence stars have the property that the surface temperature, luminosity and radius all depend on the mass of the star.
  • Compare two MS stars with different masses: the heavier star is larger, more luminous and has a hotter surface.
  • The mass of the star seems to dictate its properties!
  • The spectral classification OBAFGKM is listed in order of hottest surface temperature to coolest.
  • For Main Sequence Stars only, it is also listed in order of heaviest stars to lightest.

Mass-Luminosity Relation

  • Note that the Scale is not linear!
  • The approximate relation is L = constant x M3.5
  • A star with Mass = 10 MSun has a Luminosity = 3500 LSun
  • A small increase in mass produces a large increase in power output.
Figure 19-22


Outline of Stellar Structure Theory

  • A star's life begins when its core is hot enough (T > 10 million K) for the Hydrogen fusion reactions to turn on.
  • We call the period of time when the star is powered by Hydrogen fusion reactions the Main Sequence period of its life.
  • A star's mass dictates its Main Sequence properties.
  • If the star was formed out of a very massive cloud of Hydrogen it produces a high mass star which will be very powerful.
  • Example: if the resulting star's mass is 60 MSun, then its spectral type will be O5 V.
  • Example: if the resulting star's mass is 1 MSun, then its spectral type will be G2 V, (the same as the Sun).

Main ingredients of the theory of the Main Sequence

  • Hydrostatic and thermal equilibrium

    • forces are balanced - no motion (exception convection)
    • Flow of energy is balance - what is created is moved to the surface and emitted away.
  • Nuclear fusion

    • All main sequence stars generate their energy through the net reaction 4 H -> He.
    • The details of the reaction rates depends on the internal conditions, such as density and temperature.
    • The higher the temperature and density, the more rapidly the reactions take place.
    • If the fusion reactions take place quickly, then there is a high rate of energy generation and a high luminosity.
  • How energy is transported from the core to the surface - by radiation or convection

    • Details depend on density and temperature


Stability of Main sequence star

Main sequence stars are remarkably stable and well-behaved thermonuclear reactors. Why ? Here people failed to create controlled thermonuclear fusion reactor (Bombs are not well-controlled).

Such stability is a property of a hot ball of gas kept together by its own gravity

Consider first ball of gas without energy source inside. How it reacts to changes ? Again compare gravitational and thermal energy (heat)
  • Star shines - loses heat
  • Pressure drops.
  • To maintain hydrostatic equilibrium, gravity shrinks the star - temperature increases !

Remarkable behaviour - energy loss increases the temperature !

Without energy source in the core this process is unstable - the star will shrink further and further.

Nuclear reactions in the center satabilizes the star if fusion efficiency is higher at higher temperatures - which it is

  1. Imagine the core temperature increases by accident. Nuclear fusion becomes more efficient.
    • More energy is produced in the core, which needs to be evacuated, thus pressure on exterior layers increases
    • The core expands due to increase of pressure - which decreases the temperature, and quenches fusion. Star stabilizes
  2. Imagine the core temperature decreases by accident. Nuclear fusion becomes less more efficient.
    • Less energy is produced in the core, pressure drops
    • Pressure is insufficient to support the weight of outer layers, the star shrinks.
    • This increases the core temperature and accelerates the nucler fusion. The star stabilizes again.

Lifetime of Main Sequence Stars

  • A main sequence star is defined to be a star which converts hydrogen to helium in its core.
  • A star has only a finite amount of hydrogen, so this phase of its life can't last forever.
  • Typically, only the inner 10% of a star's mass is hot enough for nuclear reactions to take place.
  • The reaction 4 H -> He converts 0.7% of its mass into energy.
  • Total energy available for a star is

    E = 1/10 x 0.007 Mc2 = 7 x 10⁻⁴ Mc2.

  • The rate that energy is radiated from the star is L.
  • The star can fuse Hydrogen for a period of time t before running out of fuel:

    t = E/L = 7 x 10⁻⁴ Mc2/L.

  • For the Sun, tSun = 1.2 x 10¹⁰ years.
  • For other stars we can write the lifetime in the form:

    t = tSun x (M/MSun) x (LSun/L)

  • We observe that L and M are related for Main Sequence stars as:

    (L/LSun) = (M/MSun)3.5.

  • This means that the main sequence lifetimes are:

    t = tSun x (M/MSun) x (M/MSun)-3.5 = tSun x (M/MSun)-2.5

  • In other words, the heaviest stars burn up their fuel at such a high rate that their lives are very short.
  • Low mass stars burn their fuel slowly and have very long lives.


Stellar Evolution Observed in Star Clusters

  • Star clusters are groups of stars formed at the same time out of the same cloud of gas.
  • In any typical star cluster, there is a large range of masses for the stars.
  • Suppose that stars in the range of 0.1 - 50 MSun are born in the cluster at the same time.

  • Consider a few examples:

  • Type O Main Sequence stars
    • The most massive stars stars are the Type O stars which are 50 times more massive than the Sun.
    • These stars are very luminous and use up their available H very quickly.
    • Hydrogen-burning lifetime for a O5 V star is about 106 years.


  • Type A Main Sequence stars (Example: Sirius A)
    • Mass of type A main sequence stars is M = 3 MSun
    • Hydrogen-burning lifetime for a A0 V star is about 4 x 10⁸ years.


  • Type G Main Sequence stars (Example: The Sun)
    • Hydrogen-burning lifetime for a G2 V star is about 1010 years.


Evolution of a Cluster

The first million years

  • Suppose that a cluster of stars of different masses is formed so that they all begin fusing 4H -> He at the same time.
  • For the first 106 years all the stars would still have fuel and all will be main sequence stars.
  • A H-R diagram of this cluster at this young age would just show main sequence stars.
  • At the end of the first million years, the heaviest stars, the type O stars will run out of fuel and their properties will change.
  • At the end of the first million years, we would not be able to observe any type O main sequence stars in the cluster.

The Cone Nebula and the Open Cluster NGC 2264

  • Terminology: Open Cluster = Galactic Cluster = group of stars found in the plane of our galaxy.
  • The picture shows the Open cluster of stars named NGC 2264 and the surrounding ionized Hydrogen, and dust.
  • This region is about 2700 light years away.
  • The stars in this region are a couple of million years old.
Cone Nebula and Cluster NGC 2264

H-R diagram of stars in the cluster NGC 2264

  • On this diagram the Main Sequence is marked with a red line.
  • We don't see the hottest, most luminous (type O) MS stars since they have evolved out of the MS stage already.
  • The cooler stars are still collapsing and haven't yet reached their MS stage.
HR diagram of NGC 2264


After one hundred million years

  • After 108 years, all the O and B MS stars have used up their Hydrogen.
  • When we look at this cluster's H-R diagram, we shouldn't see O and B Main Sequence stars.
  • All of the less massive stars should still be in their MS stage, since they burn their H slower than the O and B stars.
The Pleiades H-R diagram for Pleiades
  • In this H-R diagram for the Pleiades we don't see any of the hottest Main Sequence Stars.
  • The "Turnoff Point" is the hottest temperature MS star which exist in the cluster.
  • The temperature can be used to estimate the age of the cluster. The hotter the turnoff point temperature, the younger the cluster.
  • The stars found above the red line correspond to the O and B stars which have left the Main Sequence.


After 3 billion years

  • After 3 x 10⁹ years, all of the O, B, and A stars have used up their H.
  • We won't see O, B, A Main Sequence stars when we plot an old cluster's H-R diagram.
  • A photo of the Open Cluster M67 is shown below.
Open Cluster M67 H-R diagram for M67
  • Here we see only the cooler main sequence stars.
  • We also see lots of Red Giants.
  • This suggests that Red Giants are what the high mass stars look like when they use up their Hydrogen.


Evolution of star clusters

  • Over time the stars on the upper main sequence move to the right.
Changes in the H-R diagram
Open Cluster Praesepe Open Cluster NGC 752
Praesepe (A.K.A. Beehive cluster = M44 in Cancer) NGC 752
about 1 billion years old about 5 billion years old


H-R Diagrams for different clusters

  • The H-R diagrams for a few different clusters can be seen.
  • The turn-off point is the point where the H-R diagram for the cluster "turns away" from the usual main sequence line.
  • Young clusters have turn-off points in the hot end of the diagram.
  • Old clusters have turn-off points in the cool end of the diagram.
  • In this diagram, NGC 2362 is younger than h+chi Persei, which are younger than the Pleiades, and so on...
  • H-R diagram together with modelling of the main sequence is used for rather precise estimate of the age of star clusters.
Figure 21-10


The (slow) Evolution of Stars on Main Sequence

The beginning of the main sequence phase is called the Zero Age Main Sequence and corresponds to the thin diagonal line drawn on a H-R diagram. But then

Chemical composition slowly changes

  • Every time a nuclear fusion reaction takes place, 4 Hydrogen nuclei are replaced by 1 Helium nucleus.
  • Ideal Gas Law: P = n kB T
  • n = number density of gas particles
  • After fusion takes place, there are fewer particles, so n decreases and the Pressure decreases.
  • If pressure decreases in the core, then gravity will pull the core particles closer together.
  • The core of the star will contract slowly and as a result will heat up.
  • This will also cause the star's luminosity and surface temperature to increase.
  • Over time, a main sequence star will slowly become hotter and brighter.
  • Main sequence is really a fuzzy band of stars for this reason.
Figure 21-1 Figure 15.15 Figure 15.15


Next lecture: The Evolution of Low Mass Stars