Lecture 31: The Cosmic Microwave Background Radiation


Temperature and Density of the Universe

  • The basic premise of the Big Bang theory of the Universe is that the Universe used to be hotter and denser than it is today.
  • The present density is estimated to be 10-27 kg per cubic meter.
  • The density is inversely proportional to the cube of the typical distance between galaxies.
    &rhom = &rhom(t0) (1+z)3
  • For example: About 6.5 billion years ago, the distances between the Local Group of galaxies and the Coma Cluster of galaxies was about half of the present distance.
    • The volume of the sphere containing the Local group and the Coma Cluster was 1/8 the present volume.
    • This means that the density of matter was 8 times larger at this early time.
Figure 28-10


Temperature of the Universe

  • The present temperature of the Universe is 2.725 K. (Based on measurements of the CMBR.)
  • The temperature of the Universe in the Big Bang theory is inversely proportional to the typical distance between galaxy clusters.
    T = T(t0) (1+z)
  • For example:
    • About 6.5 billion years ago, the distances between the Local Group of galaxies and the Coma Cluster of galaxies was about half of the present distance.
    • Astronomers living 6.5 billion years ago would have measured the Cosmic Background radiation to be 6K.
Figure 28-11

Problem: At what redshift did the Universe changed from radiation to matter dominated ? What was the temperature then ?

Solution

  • Very early he Universe was radiation-dominated &rhorad > &rhom .
  • Transition took place when &rhorad = &rhom . i.e, when
    &rhorad(t0) (1+z)4 = &rhom(t0) (1+z)3

  • Therefore, the redshift of transition is given by the present day densities of matter and radiation as

    1+z = &rhom(t0) /&rhorad(t0) ~ 5000

  • ( Actually 1.68 times less, because besides Cosmic Microwave Background Radiation there are relativistic Cosmic neutrinos, which constitute 68% of the amount of CMB and behave as radiation )
  • The temperature of the Cosmic background Radiation changes at this redshift is
    T = T(t0) (1+z) &asymp 2.725 K x 5000 = 13600 K

Can we compute the time of this or other events for which we now the redshift ?

  • This is complicated, need to solve Einstein equations. This is done in this calculator, for example.

The Opaque Period of the Universe

Q: What would you be able to see if you took a time-machine trip (in a heat insulated time machine) to the radiation dominated period of the Universe?

A: Not much.

  • At high temperatures above a few thousand Kelvin neutral atoms tend to become ionized.
  • This means that all the atoms in the early universe will be ionized and the Universe will be a plasma.
  • In order to view the Universe, photons have to be able to travel to your eyes.
  • Light has a great deal of trouble traveling through a plasma. For example, inside the Sun (which is a plasma) it takes a photon about one million years to travel the radius of the Sun.
  • In the early universe, photons are scattered so much through collisions with charged particles that the universe would appear to be opaque.
  • You would only be able to see "out" a small distance and all that you would see is light with a blackbody spectrum corresponding to the temperature of the Universe.
Figure 28-12


The Era of Recombination

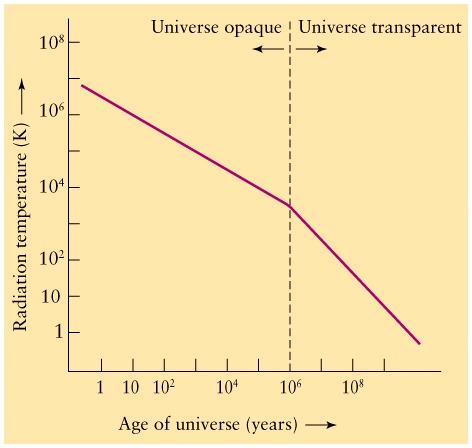
  • Today, the Universe is transparent, since photons from quasars a few billion light-years can reach our telescopes.
  • How can the Universe become transparent?
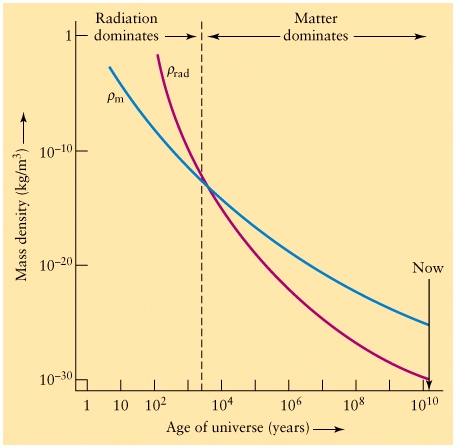
  • Get rid of the plasma: When a plasma is cool enough the protons and electrons will combine to form neutral Hydrogen which doesn't hinder photons. This occurs at a temperature near 3000 K.
  • Question: If recombination occured at T=3000 K, at what redshift did it happen ?
  • Answer
    1+z = T / T(t0) = 3000 K /2.725 K &asymp 1100
  • The time when the temperature is 3000 K is around 370,000 years after the Big Bang (use calculator) and is called the time of "recombination".
  • The reaction p + e -> H is called recombination, although in the early universe the protons and electrons had never been joined, so it should really be called "combination".
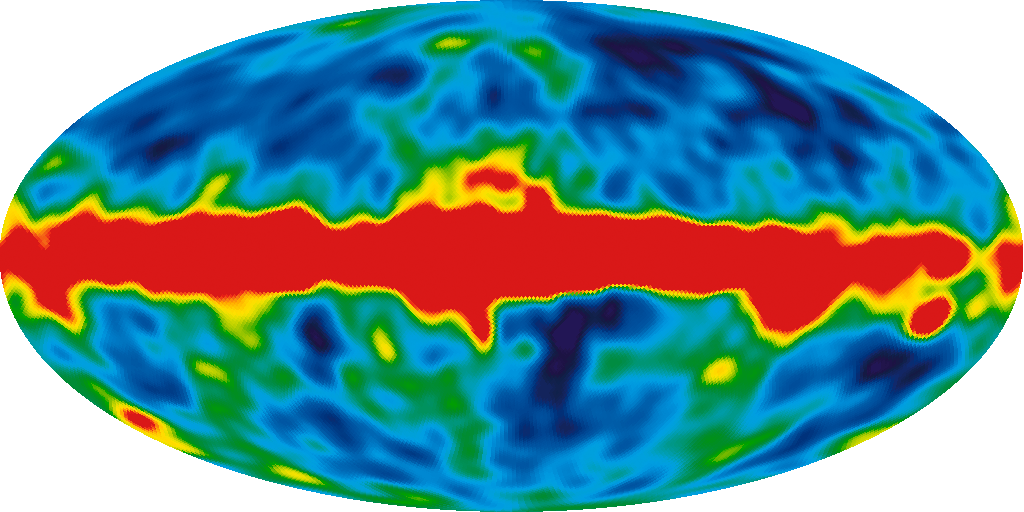
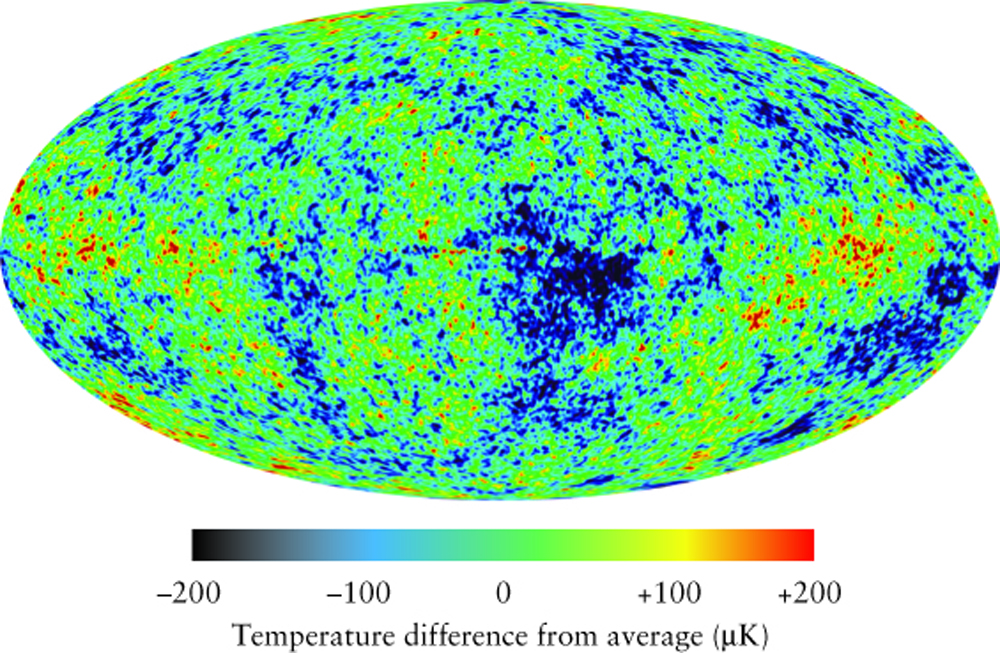
  • The time of recombination is the last time that photons collide with matter (until the photons reach our eyes).
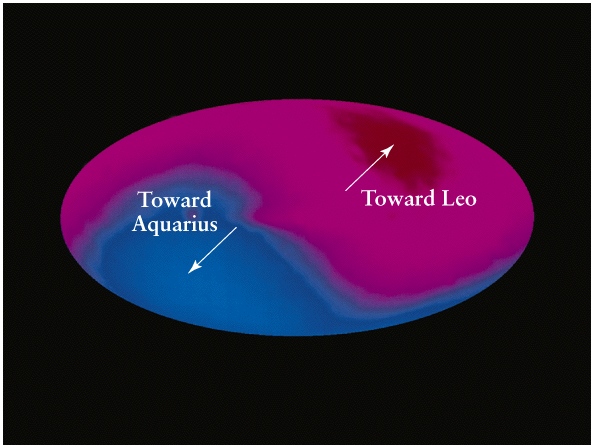
  • When the photons hit our eyes, we call them the Cosmic Background Radiation.
  • This time is also called the time of last scattering.
Figure 28-12
a) Before the recombination

Figure 28-12


Redshift of the Cosmic Background Radiation

  • As the photons travel, the universe expands causing the photons' wavelength to expand (redshift) so the photons correspond to a blackbody with a cooler temperature.
  • Eventually the photon collides with an object which might be an astronomer.
  • The photons which we measure today (which originated) in the Big Bang have a wavelength of about 1mm which corresponds to a temperature of 3 K.
  • Since 1mm corresponds to the microwave part of the spectrum, we call these photons the Cosmic Microwave Background Radiation (CMBR).


The Microwave Sky (from the COBE Satellite)

  • The average Temperature of the sky is T = 2.725 K
  • The Colour scale is backwards:
    • Red = Temperatures are hotter by 0.0033 K than average.
    • Blue = Temperatures are cooler by 0.0033 K than average.
  • This indicates that the Earth is moving in the direction towards the constellation Leo at v = 371 km/s.
Figure 28-8


Snapshots of the Universe at the Time of Last Scattering

  • The 3 K photons last collided with matter at the time of last scattering.
  • These photons which we detect then show us how matter was distributed at the time of last scattering, when the Universe was only a few hundred thousand years old.
  • Regions which were a little bit denser than average have light which is gravitationally redshifted and corresponds to a slightly lower blackbody temperature. These regions later will collapse to form galaxy clusters.
  • Regions which were a little bit less dense than average have slightly higher than average temperatures and evolve to form voids.
  • The Cobe satellite (mid 1990's) mapped the whole sky and showed the temperature (and hence density) variations in the CMB.
  • Typical angular size of regions are about 7 degrees in the sky.
  • Red = hotter than average by 30 microKelvin.
  • Blue = cooler than average by 30 microKelvin.


Boomerang

  • The Boomerang experiment (1999) mapped a smaller part of the sky than Cobe, but at much greater resolution.
  • The typical anglar size of constant density regions is about 1 degree.
  • Red = Hotter than average by 300 microKelvin.
  • Blue = Cooler than average by 300 microKelvin.
Figure 28-14

  • Photo-montage of the Boomerang balloon in front of Mnt Erebus in Antarctica with the Boomerang data.
  • If your eyes were sensitive to microwave radiation, you would "see" these patterns in the sky.
Figure 28-13


Boomerang's Flight Path

  • Boomerang is a microwave detector launched on a balloon in Antarctica.
  • A prevailing in Antarctica in summer stable air current moved the balloon kept at 40 km in the air for two weeks (while it gathered data) and then brought the apparatus back within 30 miles of the launch location for relatively easy recovery


WMAP Results (2008)

  • WMAP = Wilkinson Microwave Anisotropy Probe
  • WMAP is a satellite which has mapped the full sky with a resolution similar to Boomerang.
  • For more details/images click on the picture
WMAP Data

Why are the Boomerang and WMAP Data Important?

  • The size of a constant-temperature region is fixed by the size of the horizon at the time of last-scattering.
  • (The horizon is the distance over which a photon can travel during the age of the universe).

The physical size of the spots can be computed - it provides the standard yardstick placed very far at redshift z=1100 when Universe was 370,000 years old

  • The apparent angle over which the region is spread depends on the geometry of the universe.
  • If the geometry is flat, the average size of spots is about one degree.
  • If the geometry of the universe is closed an effective defocusing occurs and the average angular size of the spots is greater than one degree.
  • If the geometry is open, corresponding to a hyperbolic geometry like a saddle, the average size of the spots is less than a degree.
  • The diagrams show computer simulations of what the sky is predicted to look like for different geometries.
Figure 28-14
  • The actual data looks most like the flat geometry.

The Angular Power Spectrum

  • The analysis is done by taking all pairs of points in the data set and comparing the difference in temperature for different angular separations.
  • A plot (called a power spectrum) shows the relative number of spots as a function of the angular size of the spots.
  • The curve shows the theoretical prediction for a flat geometry and the red points are the measurement.
  • There is a pretty good fit to a universe with a flat geometry, although the geometry could be only slightly curved and still fit.


Current Favourite Cosmological Model

  • The Big Bang is a family of models which are described by two parameters, &Omegam and the Cosmological Constant.
  • &Omega&Lambda is proportional to the Cosmological Constant.
  • The two parameters can be plotted against each other as on the diagram below.
  • If &Omegam + &Omega&Lambda = 1, the geometry is flat
Figure 28-19

Different Big Bang Models

  • The vertical axis corresponds to the Cosmological Constant.
  • The horizontal axis corresponds to the fraction of the matter density to the critical density.
  • Each point on this diagram corresponds to a different type of Big Bang model. Our goal is to figure out which model describes our Universe.
  • A flat geometry corresponds to any point on the blue diagonal line.
  • 10 years ago, most astronomers thought that the universe corresponded to &Omegam = 1 and zero cosmological constant.
  • The Boomerang experiment show that the geometry of the universe is very close to flat, so only models corresponding to the green region are allowed.
  • The Supernovae observations (discussed in the previous lecture) only allow models in the blue region of the diagram.
  • The only consistent models are those in the overlapping green region.
  • The models favoured by today's observations have &Omegam = 0.27 ± 0.03 , &Omega&Lambda = 0.73 ± 0.03 and H0=71 ± 2 km/s/Mpc
  • All of the allowed models will expand forever and will not recollapse in a Big Crunch.


    Next lecture: The Early Universe