Accelerating Rebound in Consumption Continues to Drive China’s Economic Growth
Shaoyan Sun and Guofeng Wu - 23 November 2020
Data released by China's National Bureau of Statistics (NBS) on October 19, 2020, shows that China's economic recovery accelerated over the third quarter. NBS announced that China's economy grew by an annualized rate of 4.9% in the April-June period year-on-year, accelerating from 3.2% in the second quarter and a contraction of 6.8% in the first quarter of 2020 (see Figure 1). However, third quarter GDP growth underperformed 5% growth estimates by major forecasters. The primary, secondary, and service sectors expanded at rates of 3.9%, 6.0%, and 4.3%, respectively.
Figure 1.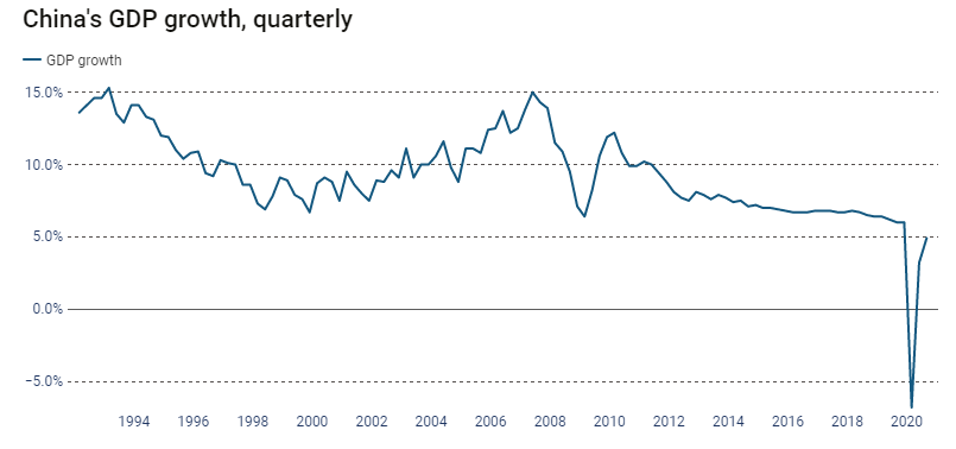
Source: created by The South China Morning Post (SCMP) based on data from NBS
With growth nearly reaching 5%, the third quarter marked a recovery milestone since March 2020 when China's economy began to rebound as the COVID-19 epidemic was contained. Major indicators, such as industrial production, service, retail sales, investment, exports, and FDI attraction all report substantial expansion from the second quarter. The financial and labour markets were also on a recovery track, as expansionary monetary policy continued to support the economy. In the third quarter, industrial production and service output rose by 5.8% and 4.3% year-on-year respectively, faster than the second quarter’s 4.4% and 1.9%. Quarterly retail sales and trade also both returned to positive growth for the first time this year, up 0.9% and 7.5% respectively, versus decreases of 3.9% and 0.2% in the second quarter. China's residents' real disposable income also turned positive in the third quarter with an increase of 0.6% after adjusting for inflation. These rebounds signal a positive outlook for China's economic growth where domestic production and consumption, or “internal circulation”, is the primary driver of growth.
That said, industrial sectors are still leading the recovery. Industrial production, a gauge of activity in the manufacturing, mining, and utility sectors, grew by 6.9% in September year-on-year after a 5.6% rise in August. September’s industrial output marked the strongest year-on-year monthly increase so far in 2020, beating analysts’ expectations. Overall, in the third quarter, industrial sectors' output increased by 5.8%, an improvement of 1.4% from the second quarter. In the first three quarters, China’s added value in major industrial enterprises grew by 1.2 % from a contraction of 1.3% one year earlier. All three sectors show signs of strong recovery from the slump in the first quarter. The manufacturing and utility sectors accelerated at a rate of 1.7% and 0.8%, respectively, although the mining sector declined by 0.6% in the first nine months. The information, communication, and electronic equipment sector and the electrical and machinery sector were the two fastest growing high value-added sectors in the first three quarters.
Figure 2.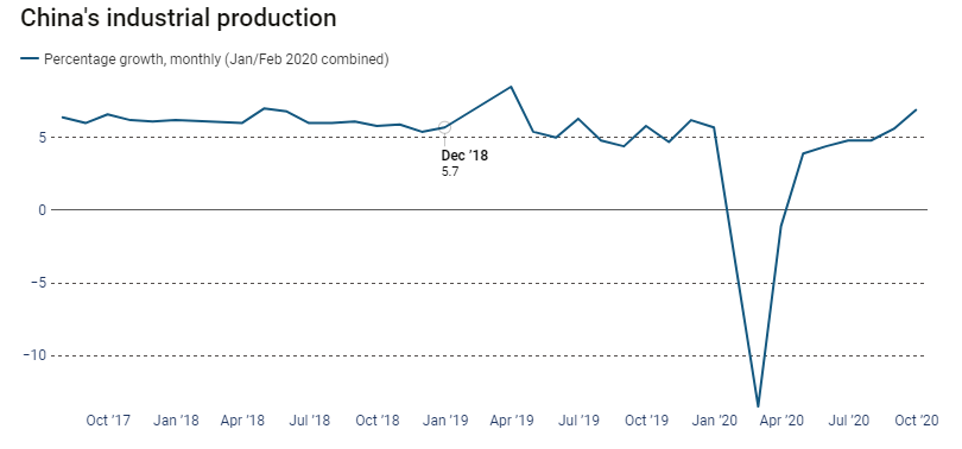
Source: created by The South China Morning Post (SCMP) based on data from NBS
With the industrial sectors sustaining their momentum, Chinese consumer spending has begun catching up. Retail sales, a key measurement of consumer spending on goods and services in China, went up by 3.3% in September, expanding for the second straight month following August's 0.5% rise. This is well above the 1.6% median estimate in a Bloomberg survey of economists. Additionally, at 0.9%, growth of retail sales in the third quarter turned positive, however, its overall decline still stands at 7.2% for the first nine months of 2020. Online sales continued to lead the recovery of the retail sector. Conventional goods and services providers, such as grocery stores, hotels, and restaurants were also afforded significant improvements in the third quarter. Data on China's "golden week" holiday shows an average year-on-year daily increase of 4.9% in retail sales and catering services. The number of tourists and tourism sector revenue also returned to 80% and 70% of last year's level, respectively. The recovery of momentum in consumer spending is a positive sign for continued GDP growth in the last quarter of 2020.
Figure 3.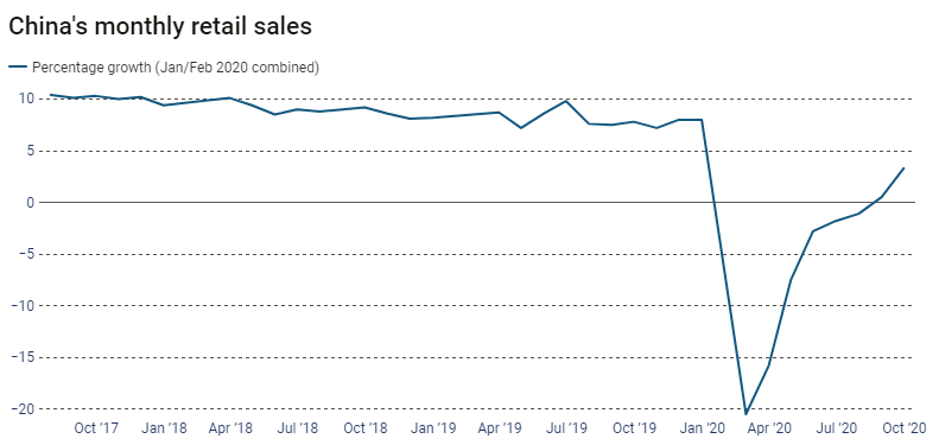
Source: The South China Morning Post (SCMP) based on data from NBS
Fixed-asset investment, a gauge of spending on infrastructure, property, machinery, and equipment rose by 0.8% in the first nine months of the year, after dipping 0.3% in the first eight months, marking the first positive year-on-year growth of investment in 2020. Infrastructure investment increased by 0.2% in the first three quarters, returning to growth from its initial contraction, albeit still slower than market expectations. Manufacturing investment remains subdued amid enhanced uncertainties surrounding U.S.-China relations. Property investment continued to outperform, expanding 5.6% in the first nine months, and is raising concerns regarding the climbing debt levels of Chinese real estate enterprises. State-spending remained the leading force in investment, as private fixed-asset investment continued to contract.
China’s total trade volume amounted to US$ 1266.9 billion in the third quarter of 2020 with a year-on-year increase of 7.5%, which was a major recovery considering trade decreased year-on-year by 6.5% in the first quarter and 0.2% in the second quarter. The trade rebound in the third quarter could be attributed to both the resumption of production, which promoted exports, and the economic recovery that raised demand for foreign products therefore contributing to imports, said the spokesperson of China’s National Bureau of Statistics on October 19, 2020. The year-on-year growth in trade volume was 3.4% in July, 4.2% in August and 11.4% in September. The big jump in September was mainly due to the expansion of imports with a year-on-year growth of 13.2%, compared to -1.4% in July and -2.1% in August. Steady increases in China’s exports occurred across all months in the third quarter with growth rates of 7.2% in July, 9.5% in August and 9.9% in September.
China’s inbound Foreign Direct Investment (IFDI) reached US$ 103.3 billion over the first three quarters at a year-on-year increase of 2.5%. The largest increase in foreign investment came from the Netherlands, with a year-on-year increase of 150%, followed by a year-on-year increase of 32.8% from the United Kingdom. China’s inbound FDI amounted to US$ 9.1 billion in July, US$ 12 billion in August and US$ 14.3 billion in September, with a year-on-year increase of 12.2%, 15% and 23.7% respectively. These year-on-year increases have now run for six months, starting in March. Additionally, technology-driven service industries, including E-commerce, professional services and research and design, attracted the greatest foreign investment increase, with year-on-year growth of 26.4%.
China’s non-financial Outbound Foreign Direct Investment (OFDI) reached US$ 78.9 billion for the first three quarters of 2020 with a year-on-year decrease of 0.6%, a slight improvement compared to a year-on-year decrease of 0.8% for the first half year of 2020. Non-financial OFDI in the third quarter totaled US$ 27.4 billion with US$ 8.8 billion in July, US$ 8.2 billion in August and US$ 10.4 billion in September, almost the same as in the second quarter (US$ 27.3 billion). Following a tremendous climb of 19.4% in the first half of 2020, investments in countries along the BRI (the Belt and Road Initiative) continued to grow rapidly with a year-on-year increase of 29.7% for the first three quarters, accounting for 16.5% of the total non-financial OFDI. Globally, rental and business services, manufacturing, and wholesale and retail attracted the majority of China’s OFDI, among which, the wholesale and retail sector experienced the greatest year-on-year expansion of 41.1%, followed by 18.6% increase in rental and business services.
The urban surveyed unemployment rate was 5.7% in July, 5.6% in August and 5.4% in September, which improved slightly compared to an average of 5.9% in the second quarter. The improvement of employment can partly be attributed to the increasing employment among migrant workers. The unemployment rate for migrant workers stands at 5.7% in July and 5.4% in August, which is a major improvement compared to its peak of 6.4% in April. Compared to the second quarter, two million more migrant workers were employed in the third quarter. However, 3.8 million more migrant workers were employed in the third quarter of 2019. Furthermore, the unemployment rate for young labours between 20 to 24 years of age increased year-on-year by 3.3% in July, 5.4% in August and 4% in September. The improvement in employment for young workers between 20-24 in September compared to August is mainly due to the fact that the recent college graduates gradually found jobs.
The Consumer Price Index (CPI) increased year-on-year by 1.7% in September, 2.4% in August and 2.7% in July. The contribution of food prices to CPI growth has been decreasing, at 2.68% in July, 2.33% in August and 1.69% in September. When excluding prices of food and energy, the year-on-year growth rate of core CPI was stable, with a growth of 0.5% across all three months in the third quarter. Due to the declining CPI growth rate in the third quarter, the year-on-year CPI growth rate for the first three quarters was 3.3%, compared to 3.8% for the first half year. Although CPI growth accelerated in June and July due to natural disasters including high temperatures and floods that increased pork prices, it declined in August and September as the pork supply recovered.
The Producer Price Index (PPI) decreased year-on-year by 2.1% in September, 2.0% in August and 2.4% in July. Prices of consumer goods increased year-on-year by 0.7% in July and 0.6% in August, while it decreased year-on-year by 0.1% in September. Meanwhile, the year-on-year decrease in the prices of intermediate goods was 3.5% in July, 3.0% in August and 2.8% in September. The year-on-year PPI decrease rate was 2.0% for the first three quarters, compared to 2.1% for the first half year. The year-on-year PPI declined faster from February to May due to the weak demand of manufacturing products, which is the result of the production shut down response to the pandemic. With the resumption of production since June, the year-on-year PPI decrease rate narrowed.
China’s manufacturing Purchasing Managers’ Index (PMI) was 51.1% in July, 51% in August and 51.5% in September, improving slightly compared to the second quarter in which all three months had a PMI between 50% and 51%. However, small enterprises had a relatively more difficult time recovering from the pandemic. As presented in Figure 4, the manufacturing PMI for small enterprises has been below 50% in the three consecutive months since June and recovered to 50.1% in September, while the manufacturing PMI for large- and medium-sized enterprises has been above 50% since March (except for the manufacturing PMI for medium-sized enterprises in May which was 48.8%).[1] The non-manufacturing business activity index was 54.2% in July, 55.2% in August and 55.9% in September. The comprehensive PMI was 54.1% in July, 54.5% in August and 55.1% in September. All three indexes have been above 50% since March, which provides evidence that the Chinese economy is undergoing a steady recovery.
Figure 4.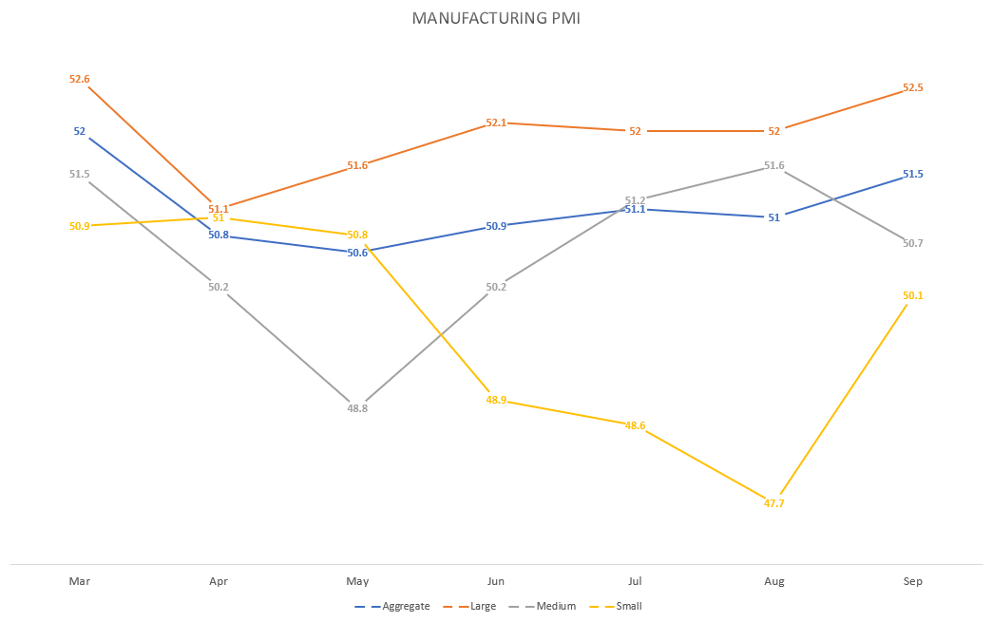
Source: created by the authors based on NBS data
[1] Large-sized enterprises are those with revenues more than 400 million RMB and employees more than 1000, medium-sized enterprises are those with revenues between 20 million RMB and 400 million RMB and employees between 300 and 1000, small-sized enterprises are those with revenues between 3 million RMB and 20 million RMB and employees between 20 and 300.

Shaoyan Sun Postdoctoral Research Fellow
Shaoyan's current research at the China Institute specializes in Canada-China trade and economic relations, the economic impact of trade barriers on the bilateral Canada-china trade, the impact of China-Canada investment on firms in both countries.

Guofeng Wu Postdoctoral Research Fellow
Guofeng's current research at the China Institute specializes in China’s foreign trade and investment policy, the development of China’s service trade, and economic relations between Canada and China.