Laboratory Experiments on Volcanic Ash Dispersion
|
Experiments and Research performed by Youn Sub Hong, Engineering Science, U. Toronto
May - August 2014
|
Background
This research project focuses on the sedimentation of particles that
settle near a large volcanic eruption.
During a large volcanic eruption, hot air, debris and ash rise and ultimately spread in the stratosphere.
Where the ash spreads and settles is important for assessing hazards to nearby communities and air traffic. Little is known about the dynamics governing particle bearing plumes of hot fluid rising in a stratified fluid.
Our research employs a recently developed light attenuation technique to measure the height and spread of sediments on the ground after they are carried upward and radially outward by a spreading forced plume.
Experimental Set-up
The experiment is performed in a 50.0 cm cube tank containing a fluid with a linearly decreasing salinity (hence density) with height. An electroluminescent light sheet under the tank provides a source to measure sediment depth. Dyed water and 10-100 micrometer glass beads are injected from a nozzle at the base of a tank filled with the salt-stratified fluid. The injected fluid rises initially as a forced negatively or positively buoyant plume, entraining ambient fluid until it becomes negatively buoyant and then spreads radially at its neutral buoyancy. Meanwhile the rising and spreading particles fall and settle to the bottom of the tank.
Figure 1.1: Front and Top view of tank and nozzle and calibration
(click image for movie)
Parameters:
Particle density (plastic): 1.1g/cm^3
Particle mean diameter: 0.10 mm
Concentration of injected particles: 2.9% by mass
Ambient salinity at nozzle: 1.0200 g/cm^3
Flow rate at nozzle: 19.00 cm^3/s
|
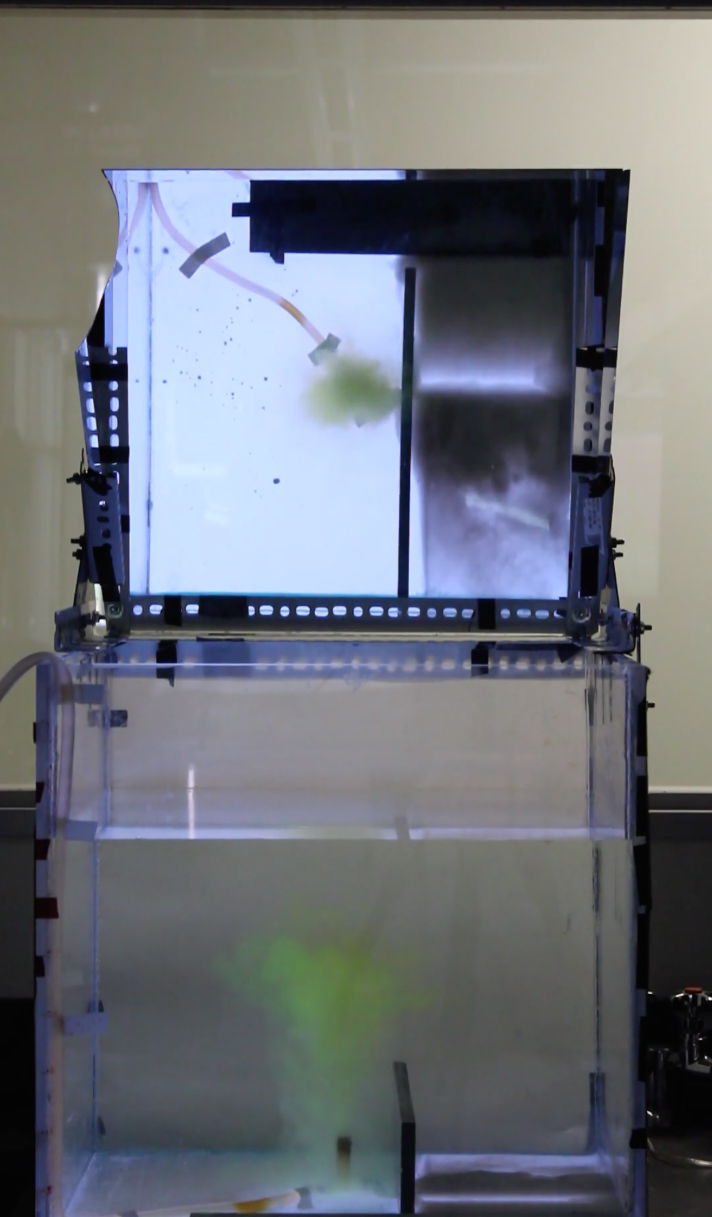
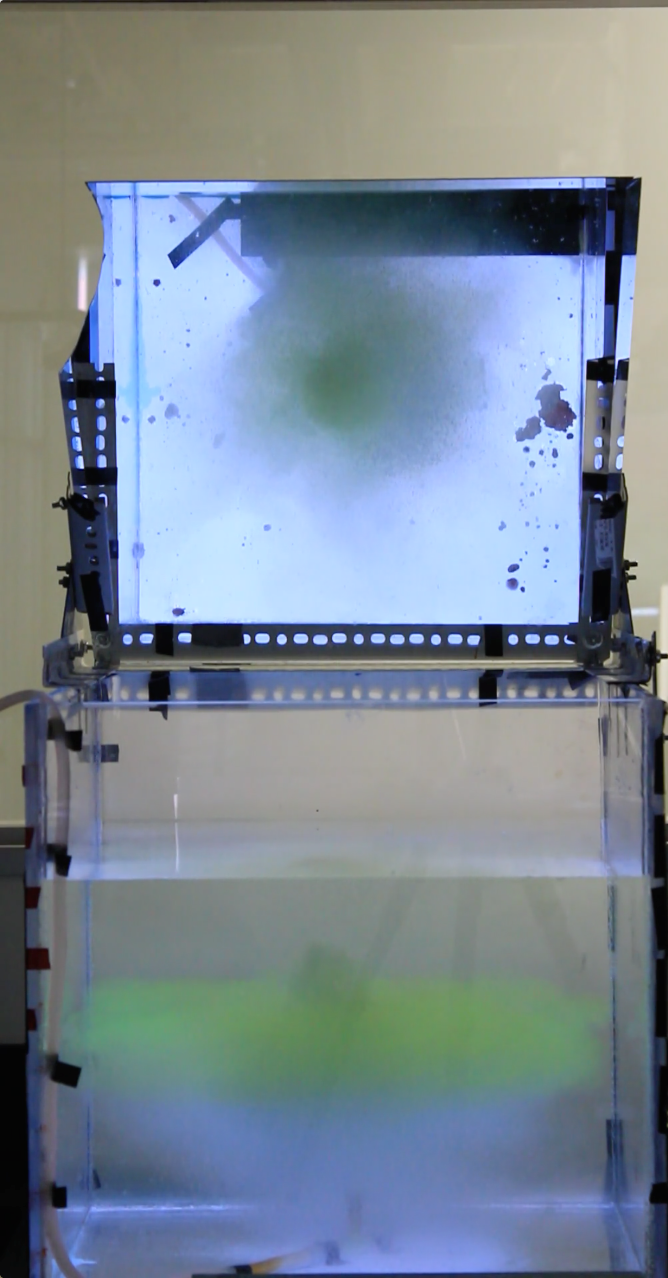
Figure 1.2: Front and Top view of tank and nozzle and calibration
(click image for movie)
Parameters:
Particle density (glass): 2.5 g/cm^3
Particle mean diameter: 0.10 mm
Concentration of injected particles: 3.6% by mass
Ambient salinity at nozzle: 1.0200 g/cm^3
Flow rate at nozzle: 21.00 cm^3/s
|
Using a recently developed technique, the attenuation of light passing through the resulting settled particle mound is recorded and converted to a height measurement. Azimuthally averaged height values are plotted with respect to the radius and fit to a Gaussian distribution. MatLab is used to convert snapshots of the particle mound at the end of experiments and convert these to false-colourintensity plots (Figure 2.1). Using the light-attenuation method, this is converted to measure the height of the mound (Figure 2.2). Azimuthally averaging gives the height versus radius, which is fit to a Gaussian (Figure 2.3).
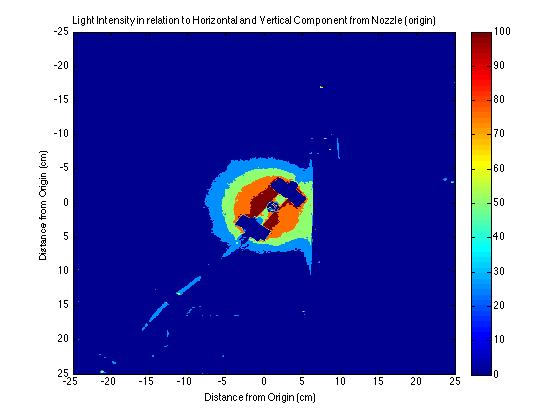
Figure 2.1: Light Intensity versus Radius Graph
|
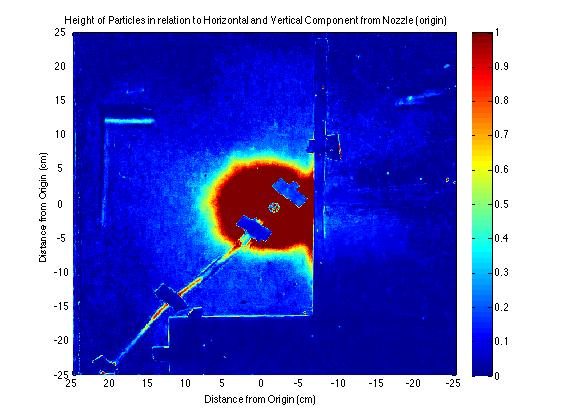
Figure 2.2: Height versus Radius Graph
|
Figure 2.3: Azimuthally averaged Height versus Radius Graph with Gaussian fit applied
|
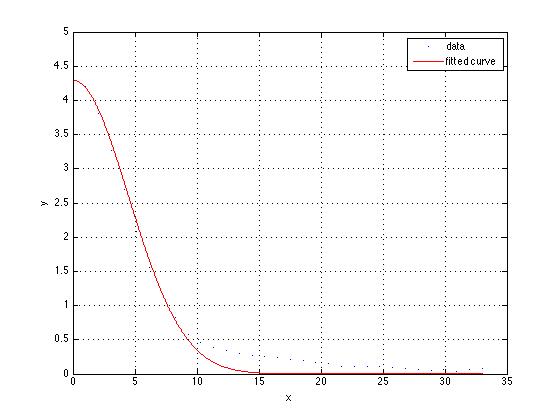
From this, the measured maximum heights and the standard deviations are expressed empirically as a function of the particle size and concentration, volume flux of the plume at the source and the ambient stratification. These results will be rescaled to predict the settled particle height distribution around a volcanic eruption site.
Results
The maximum and spread height of the plume, as well as the height and spread of the settled particle mound, are tabulated as they depend upon the experiment parameters. The following table presents the variables and results of the experiments performed.
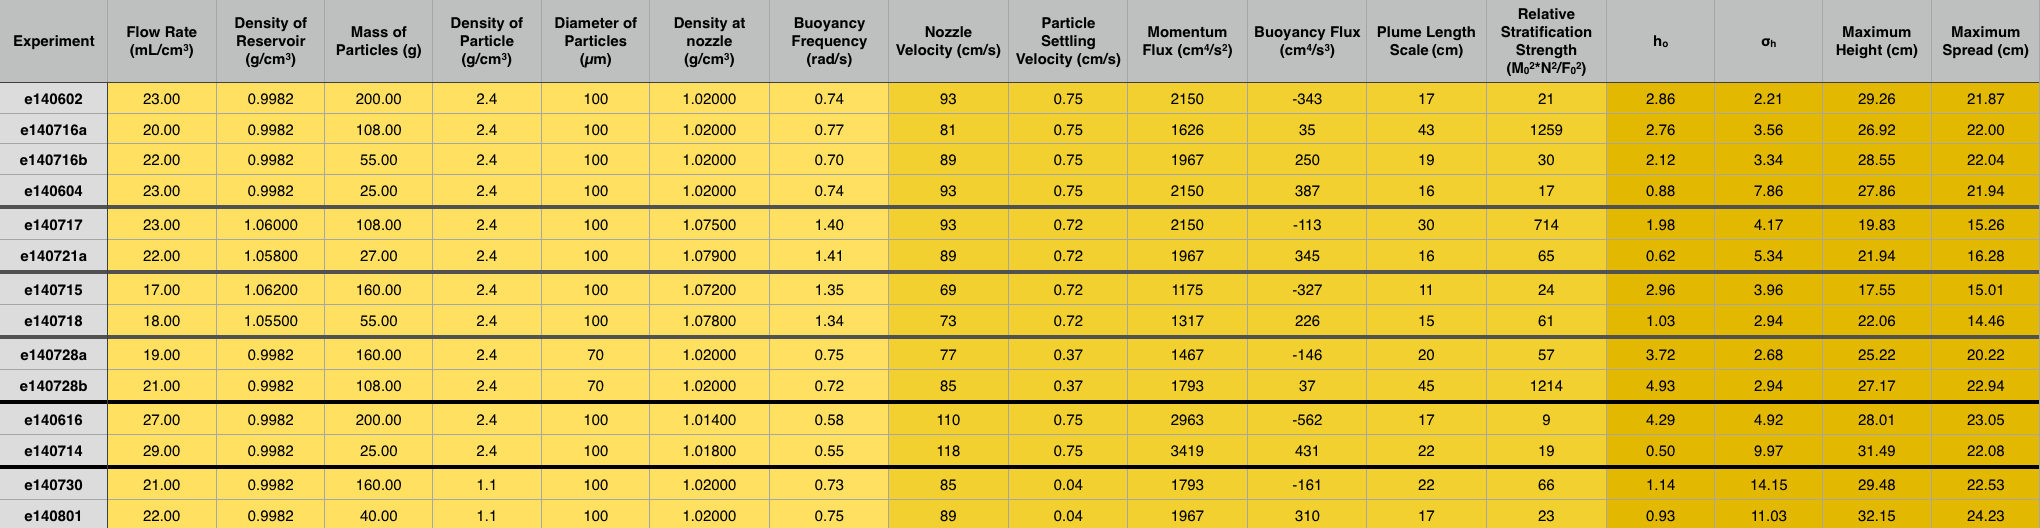
Figure 3: Table of Raw Data and Results
|
Some noticeable trends can be found from the above graph:
- As the density of the particles decrease, so does the h value in the Gaussian equation
- The spread of the particles across the base (measured indirectly by sigma) increases as the particle density decreases
- As the base stratification of the medium decreases, h increases
- The value of h increases with a smaller particle diameter while the value of sigma decreases
- As the flow rate increases, h decreases while sigma increases
Future work will develop theory for the spread of sediments from particle-laden plumes and will compare its predictions with the results of these experiments. The results will then be scaled to predict the spread of ash from volcanic eruptions.
Acknowledgements
This research was financially supported by grants from:
Special thanks to Dr. Bruce Sutherland and everyone in his research group for this amazing experience.
Return to
Research Interests page
Bruce's home page
Department of Physics
Department of Earth and Atmospheric Sciences