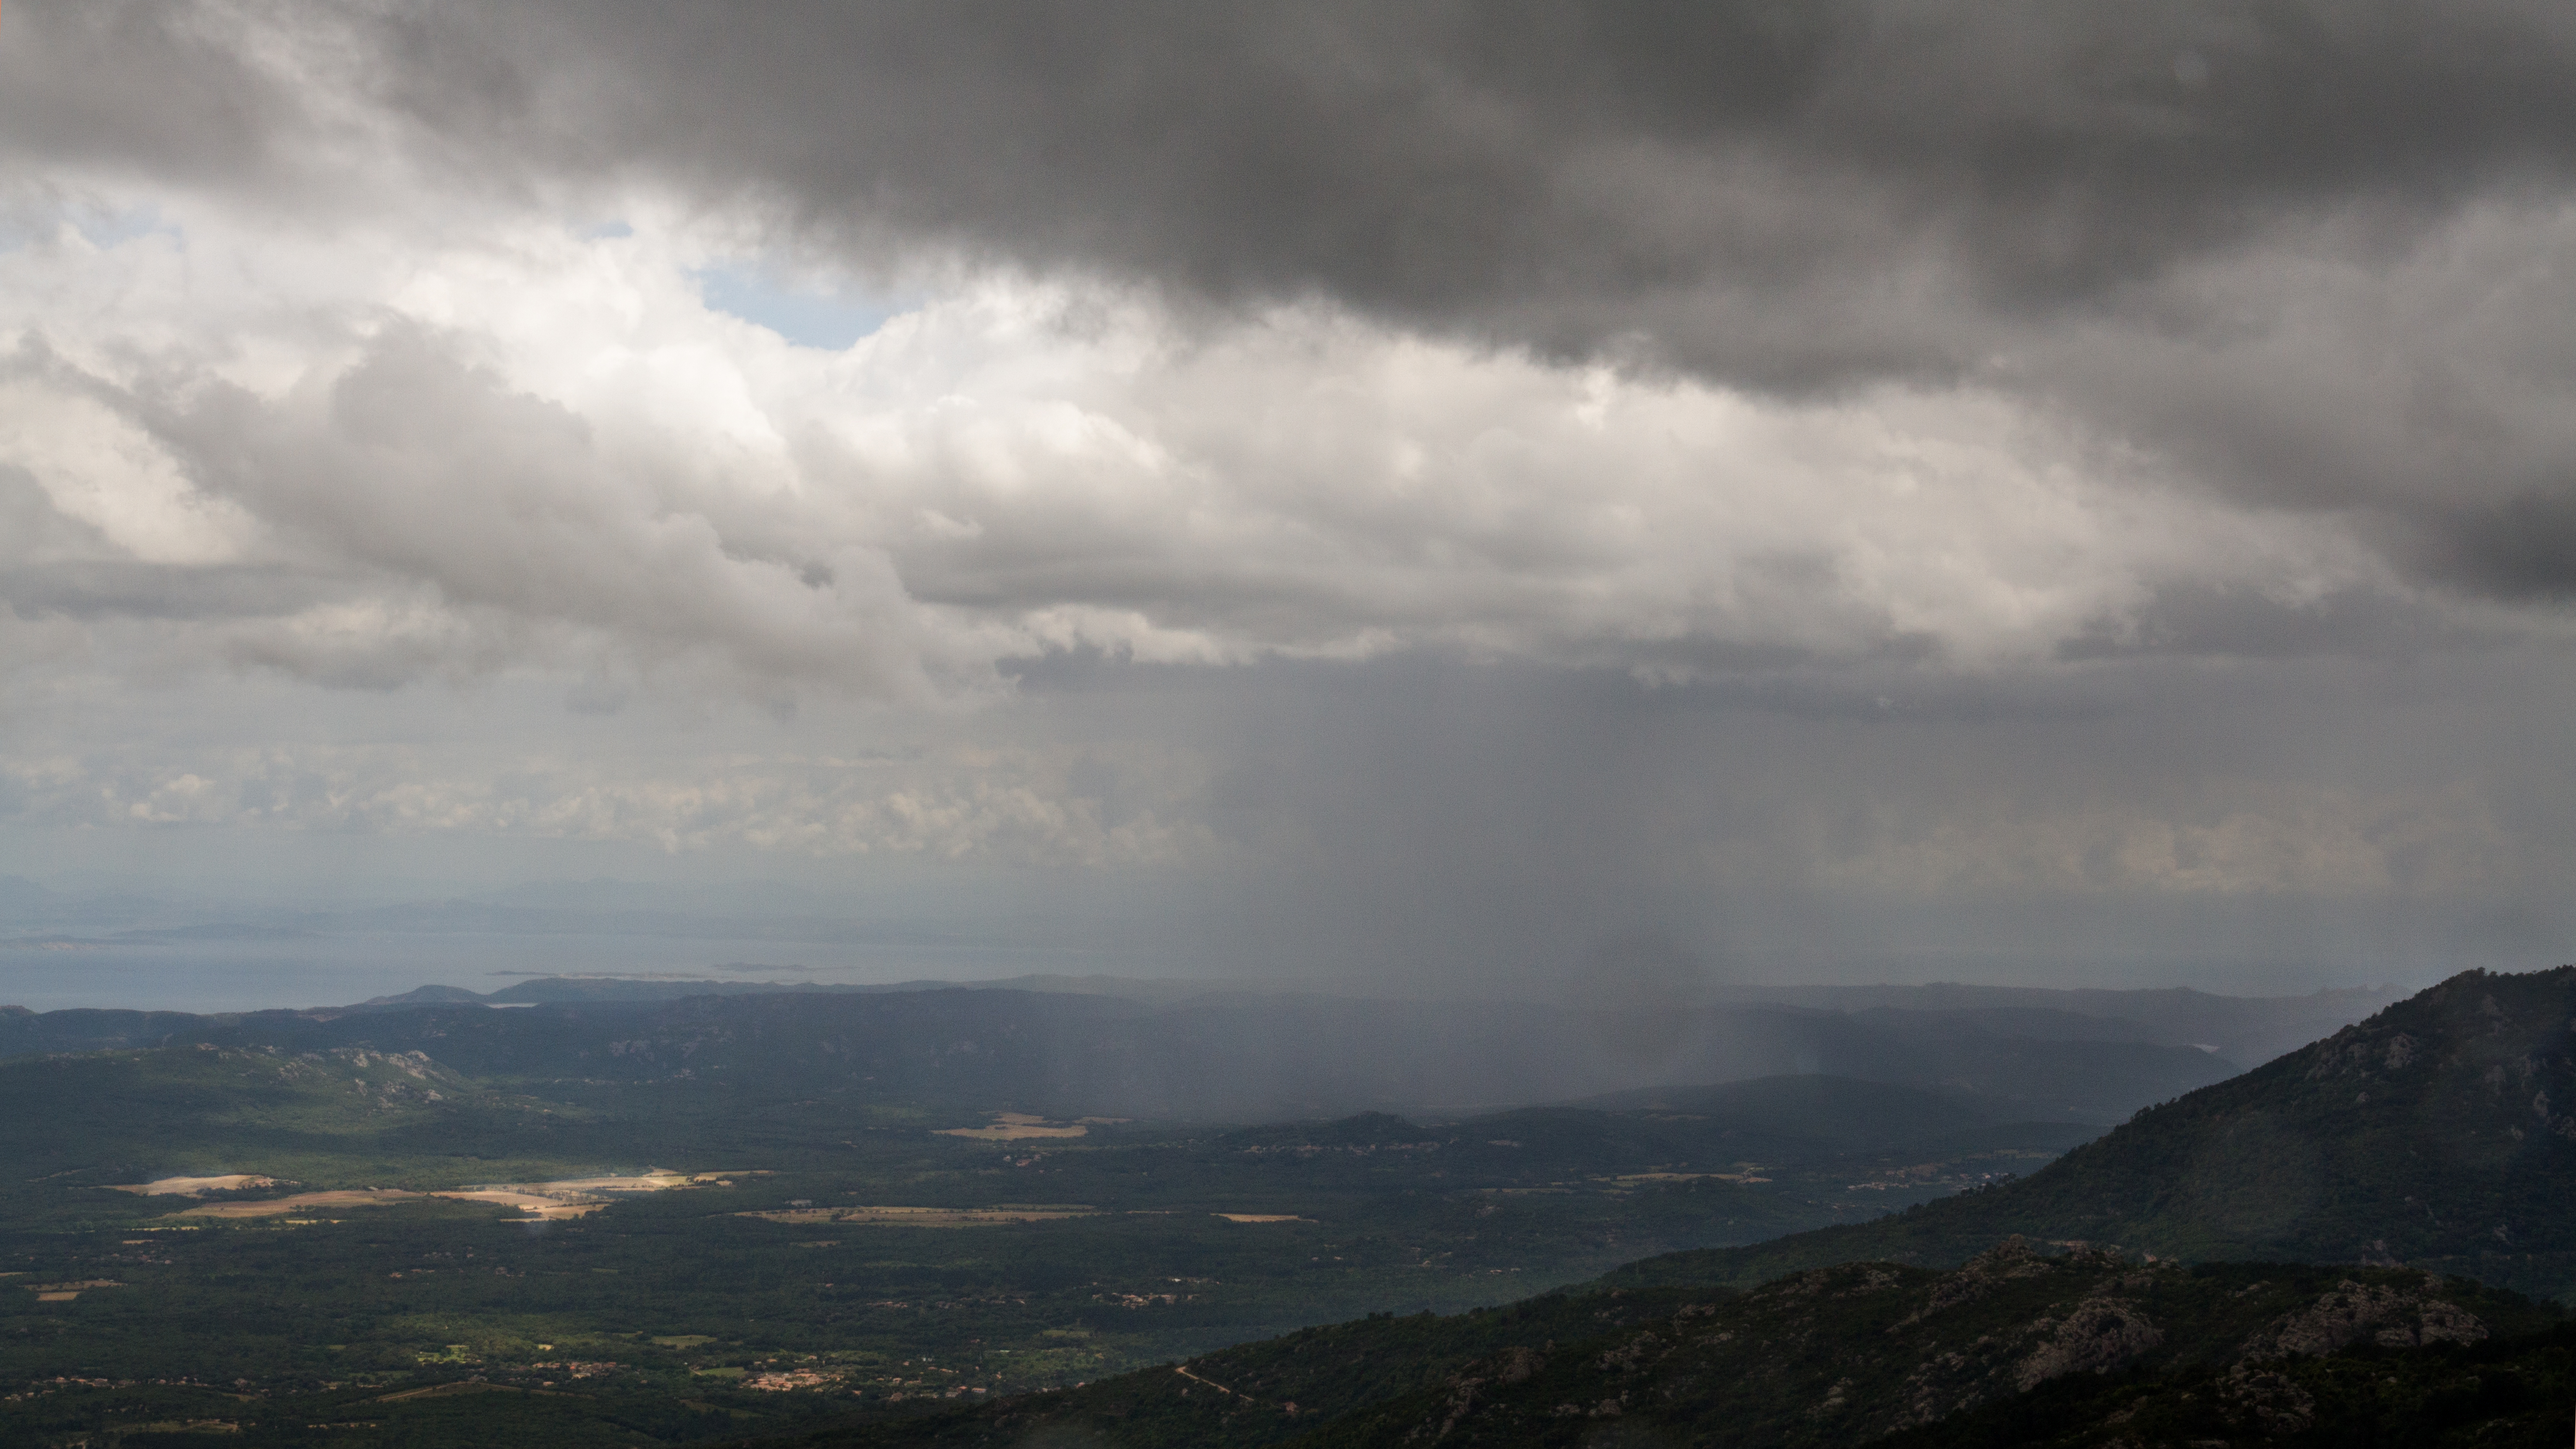
Localized precipitation due to a small convective cell
Photo credit: Bernard Chocat [1]
May 2021 - August 2021,
Departments of Physics, University of Alberta
|
Localized precipitation due to a small convective cell Photo credit: Bernard Chocat [1] |
|
Experiments and Research performed by Samir Marsa, May 2021 - August 2021, Departments of Physics, University of Alberta |
Our research was inspired by the observations in Dr.Sutherland's prior research "A Novel Approach to Investigate the Deposition of (Bio)chemical Sediments" [2], whereby it was observed that convective currents formed during experiments that replicated Archean ocean conditions. To gain a fundamental understanding of these convective patterns formed during to in situ particle formation, it was necessary to isolate the main contributing factors: particle growth rate and density. This was accomplished in our research by carefully varying the pH and iron ion concentration of our mixtures. The theories developed by our research have a variety of applications in situations where particles form while suspended, one such example of this is the formation of raindrops in atmospheric clouds.
All the experiments were performed in an acrylic tank with internal dimensions (L:W:H) of 20.0:7.5:29.5 cm's. The preparation for a given experiment worked as follows: In a large beaker, stock sodium hydroxide solution is diluted to the desired pH using deionized water, the pH is then measured using a pH meter and then a 1.5 L volume is transferred into the tank. In a graduated cylinder, a calculated amount of stock ferrous chloride tetrahydrate is measured such that when mixed with the sodium hydroxide solution results in the desired FeCl2 concentration. Once the solutions have been prepared the experiment can be conducted. In a darkened room the tank is backlit using a defused led flood light. The ferrous chloride is then poured into the tank and mixed to create a homogeneous mixture. Images are then captured every second or every 2 seconds by a camera placed perpendicular to the tank (Figure 1).
Figure 1: 24x Experiment Timelapse (Parameters: pH = 12.19 , FeCl2 Concentration = 1100μM)
|
Figure 2: PIV overlayed on grayscale timelapse movie
|
Figure 3: Movie of probability density histogram
|
I'd like to take this opportunity to thank Dr. Bruce Sutherland for giving me this opportunity to learn and build a new skill-set as well as my colleagues for making a welcoming and enjoyable atmosphere.
Department of Earth and Atmospheric Sciences