May 2004 - August 2005,
Department of Mathematical and Statistical Sciences, University of Alberta
|
|
|
Experiments/Research performed by Dawn Aguilar, May 2004 - August 2005, Department of Mathematical and Statistical Sciences, University of Alberta |
Despite their importance, the mechanisms by which internal waves are generated from topography are poorly understood beyond the suppositions of linear and inviscid theories. The main limitation of these theories is that they neglect the processes of boundary layer separation and turbulence, both of which are important in the ocean and atmosphere. In these experiments, we explore the effects of boundary layer separation and turbulence on wave generation and compare our results with linear theory predictions.
|
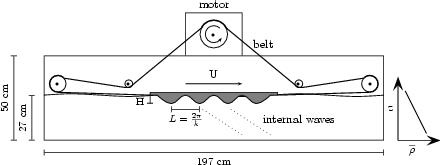
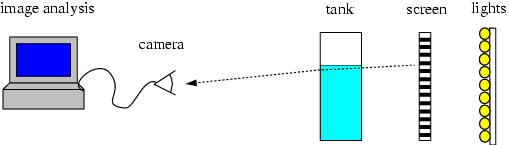
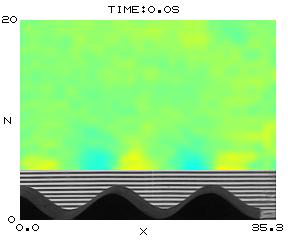
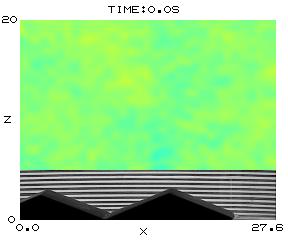
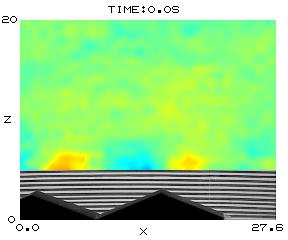
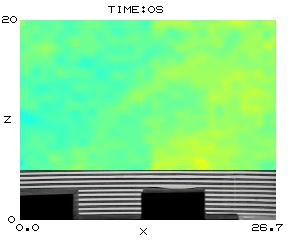
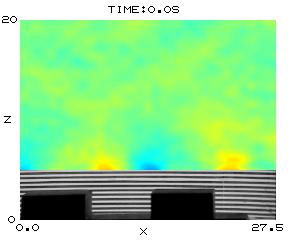
Experiments were recorded using a digital camera situated approximately 340 cm in front of the tank. Two sample recordings of experiments using large sinusoidal hills are provided below. Notice the screen of horizontal black and white lines, which is situated behind the tank and illuminated by fluorescent lighting.
Slow towing speed, Frh=0.61 (43.3MB) |
Fast towing speed, Frh=1.29 (30.0MB) |
|
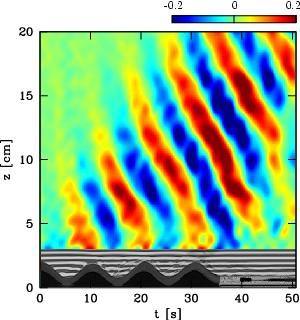
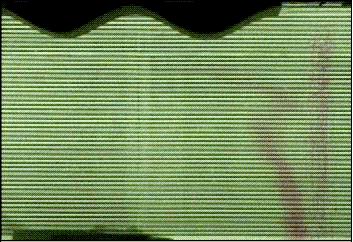
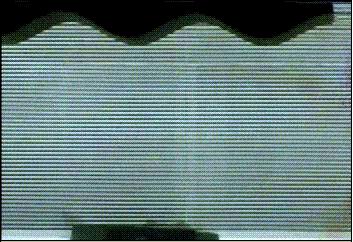
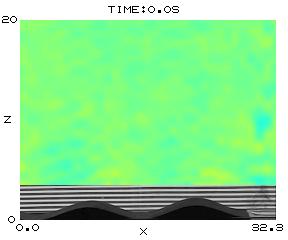
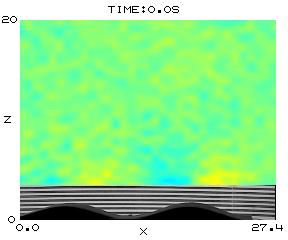
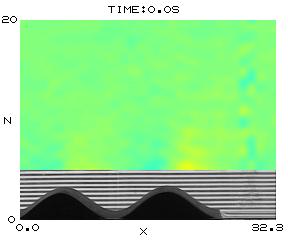
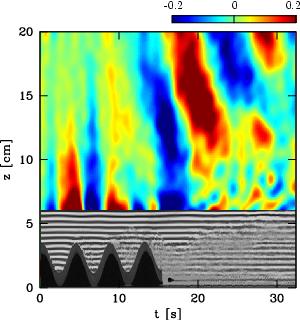
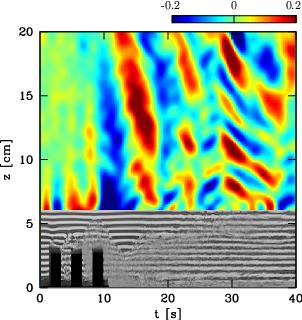
The waves themselves were visualized and their characteristics measured using the non-obtrusive optical technique, ''synthetic schlieren''. The technique records the distortion of the image of horizontal lines due to the bending of light through different density gradients. An example is provided below, which shows snapshots of an experiment taken (a) at the start of the experiment and (b) during the experiment. The qualitative schlieren image in (c), obtained by taking the difference between the images in (a) and (b), clearly reveals the regions of greatest distortion, namely the wave crests and troughs.
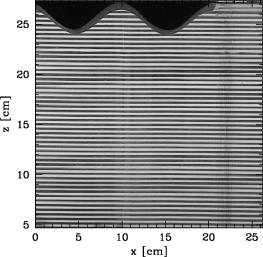
(a) Initial image |
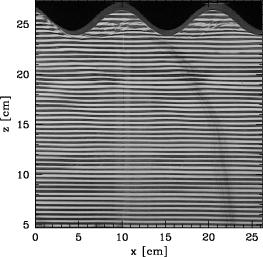
(b) Image during experiment |
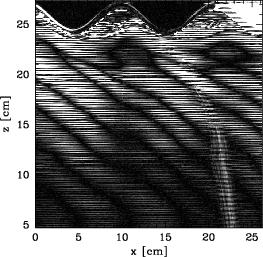
(c) Difference between (a) and (b) |
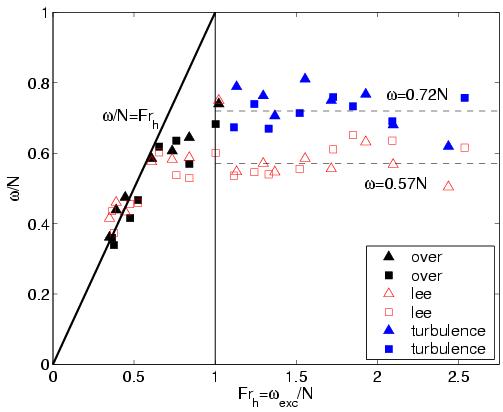
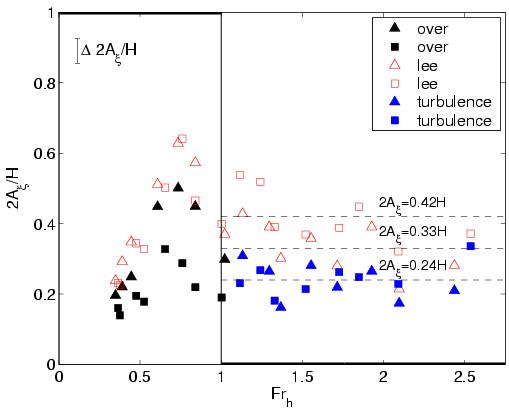
As you view these movies, pay attention to the different types of waves that emerge. For Frh<1, we observe a uniform wave field directly over the hills. The wave beams extend upwards and to the right as time evolves. For Frh>1, the waves generated directly above the hills do not propagate, consistent with the linear theory prediction that these waves should be evanescent. However, propagating waves are observed in the lee of the last hill, generated in part by flow over the trailing slope. For the steep triangular and rectangular hills, a third set of waves is observed further in the lee. These smaller-scale waves radiate away from a turbulent mixed region.
Slow towing speed, Frh=0.57 (10.1MB) |
Fast towing speed, Frh=1.38 (6.1MB) |
Slow towing speed, Frh=0.61 (11.1MB) |
Fast towing speed, Frh=1.29 (6.5MB) |
Slow towing speed, Frh=0.45 (11.2MB) |
Fast towing speed, Frh=2.13 (9.4MB) |
Slow towing speed, Frh=0.35 (10.8MB) |
Fast towing speed, Frh=1.74 (9.4MB) |
We use vertical time series images to identify the mechanisms of wave generation. Here we present three experiments that are representative of the different ways in which internal waves may be generated from topography. The three mechanisms are summarized below: (1) Topographic forcing refers to the flow of fluid into and out of the valleys and results in a regular wave field. By comparing the distance between successive crests or troughs and that between successive hilltops, we notice that they are approximately the same. This is consistent with the linear theory prediction that the wave frequency should match the excitation frequency. (2) The term "boundary-trapped lee wave" refers to the undular shear layer trailing the last hill, which is identified by the distortion of the image of black and white lines (T=14-21s). Vertically-propagating internal waves are generated directly in the lee of the last hill in part by fluid flowing over boundary-trapped lee waves. (3) Turbulence is created far in the lee of topography, provided the towing speed is sufficiently fast and the topography sufficiently steep, and results in the generation of small-scale internal waves (T=28-48s).
| (1) Topographic forcing | (2) Boundary-trapped lee waves | (3) Turbulence |
|
Small sinusoidal hills, Frh=0.57 |
Large sinusoidal hills, Frh=1.29 |
Rectangular hills, Frh=1.74 |
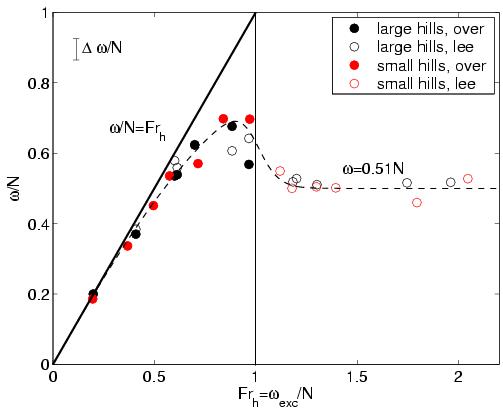
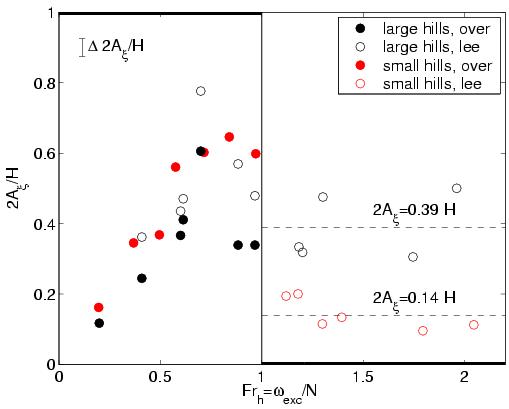
| Internal wave frequency | Internal wave amplitude |
|
|
In terms of wave frequency, experimental measurements agree well with linear theory predictions for Frh<0.7, above which occur significant departures. When Frh>1, waves are still generated in the lee and have frequencies an approximately constant fraction of N, despite the different hill heights and amounts of turbulence generated. In terms of wave amplitude, linear theory overestimates the amplitude in all cases. The reason for the reduced wave amplitudes observed in our experiments is because the fluid does not feel the full height of the hill. Rather, the fluid separates from the lee-side slopes of the hills and forms patches of stagnant fluid in the valleys. This reduces the effective hill height for wave generation. Two images illustrating flow separation and the formation of stagnant fluid are provided below. The depth of the stagnant region increases with increasing H and decreasing Frh.
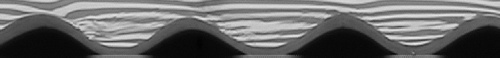
H=1.3cm, Frh=0.19 |
|
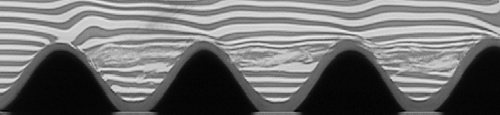
H=2.6cm, Frh=0.20 |
Next, we present the wave frequency and amplitude plots for the steeper triangular and rectangular hills. The characteristics of the waves generated directly over the hills and in the lee of the last hill are similar. Notice the addition of the blue markers, which correspond to the waves generated by the turbulent mixed region. Remarkably, these waves are generated within a narrow range of frequencies, despite the many scales associated with turbulence. This result is consistent with that of other studies involving the generation of waves from turbulence (see for example,
Dohan and Sutherland, 2005 ).
| Internal wave frequency | Internal wave amplitude |
|
|
Department of Earth and Atmospheric Sciences