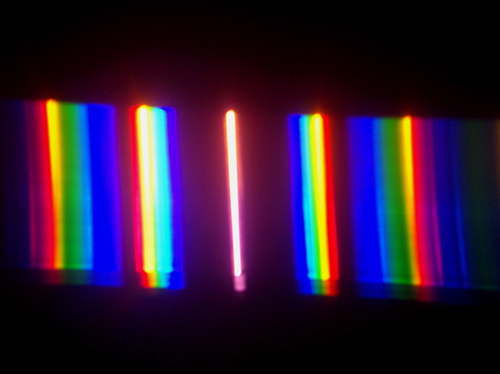
- For one, this is the main technique to split the light into spectral components according to the wavelengths used in modern spectrographs
|
|
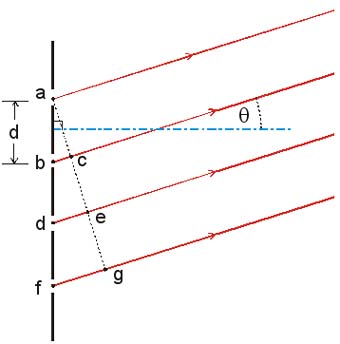
| What is the distribution of the electric field on the screen between diffraction grating that consists of N parallel slits, each of width a and separated by distance d ? |
|
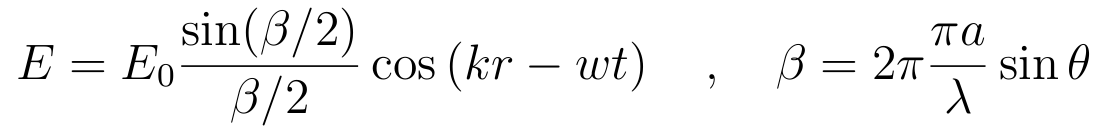
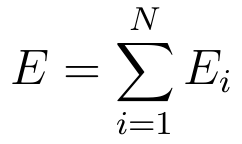
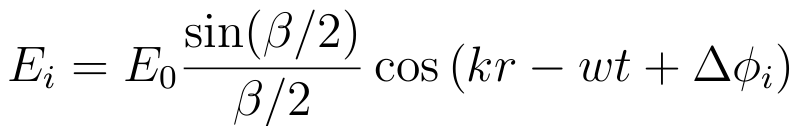 and the total is just
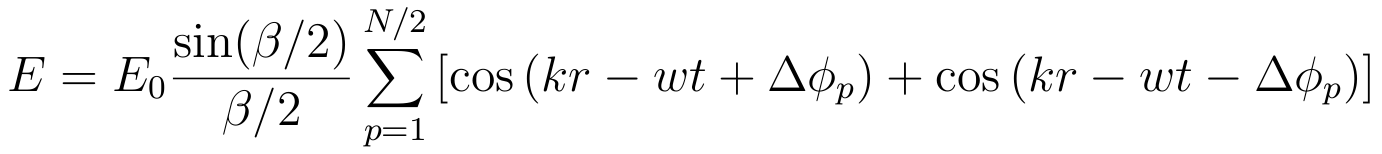
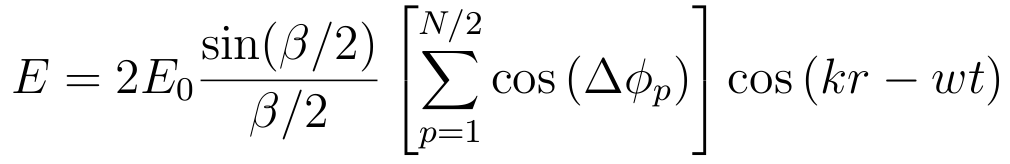
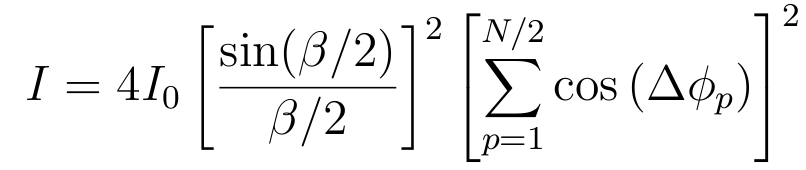
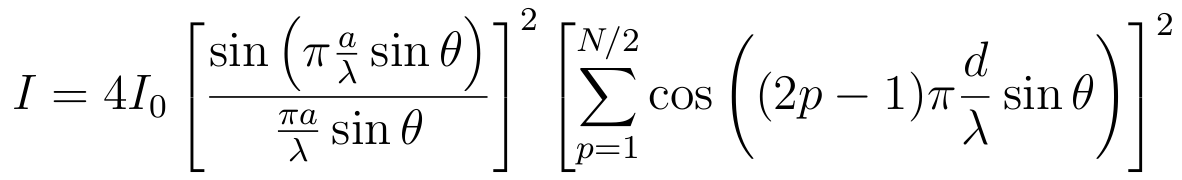
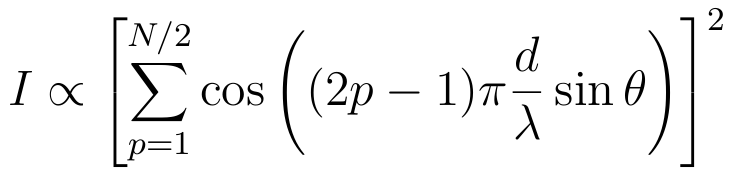
| N slits: |
 |
|---|
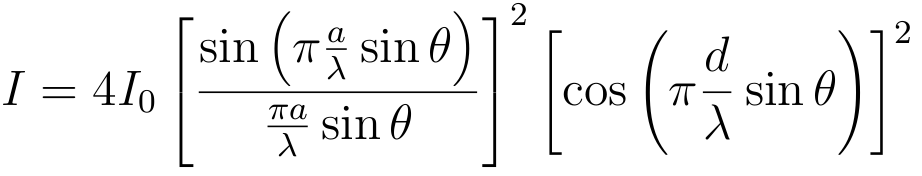
| Two slits: |
 |
|---|
| Double slit intensity pattern, d > a (on the plot the width a is marked as b). Single slit diffraction factor oscillates with lesser frequency and modulates the higher frequency multi-slit interference factor, which determines maxima and minima of intensity. |
|
|

|
| Modern spectrograph utilize diffraction gratings of different construction to achieve this result. Its basic optical scheme looks like in the figure to the right. |  |
|
|