The software, downloadable from this web page, can be used to estimate more than 50 monthly, seasonal, and annual variables, including many economically or biologically relevant variables such as growing and chilling degree days, heating and cooling degree days, Hargrave's moisture deficit and reference evaporation, beginning and end of the frost-free period, etc.
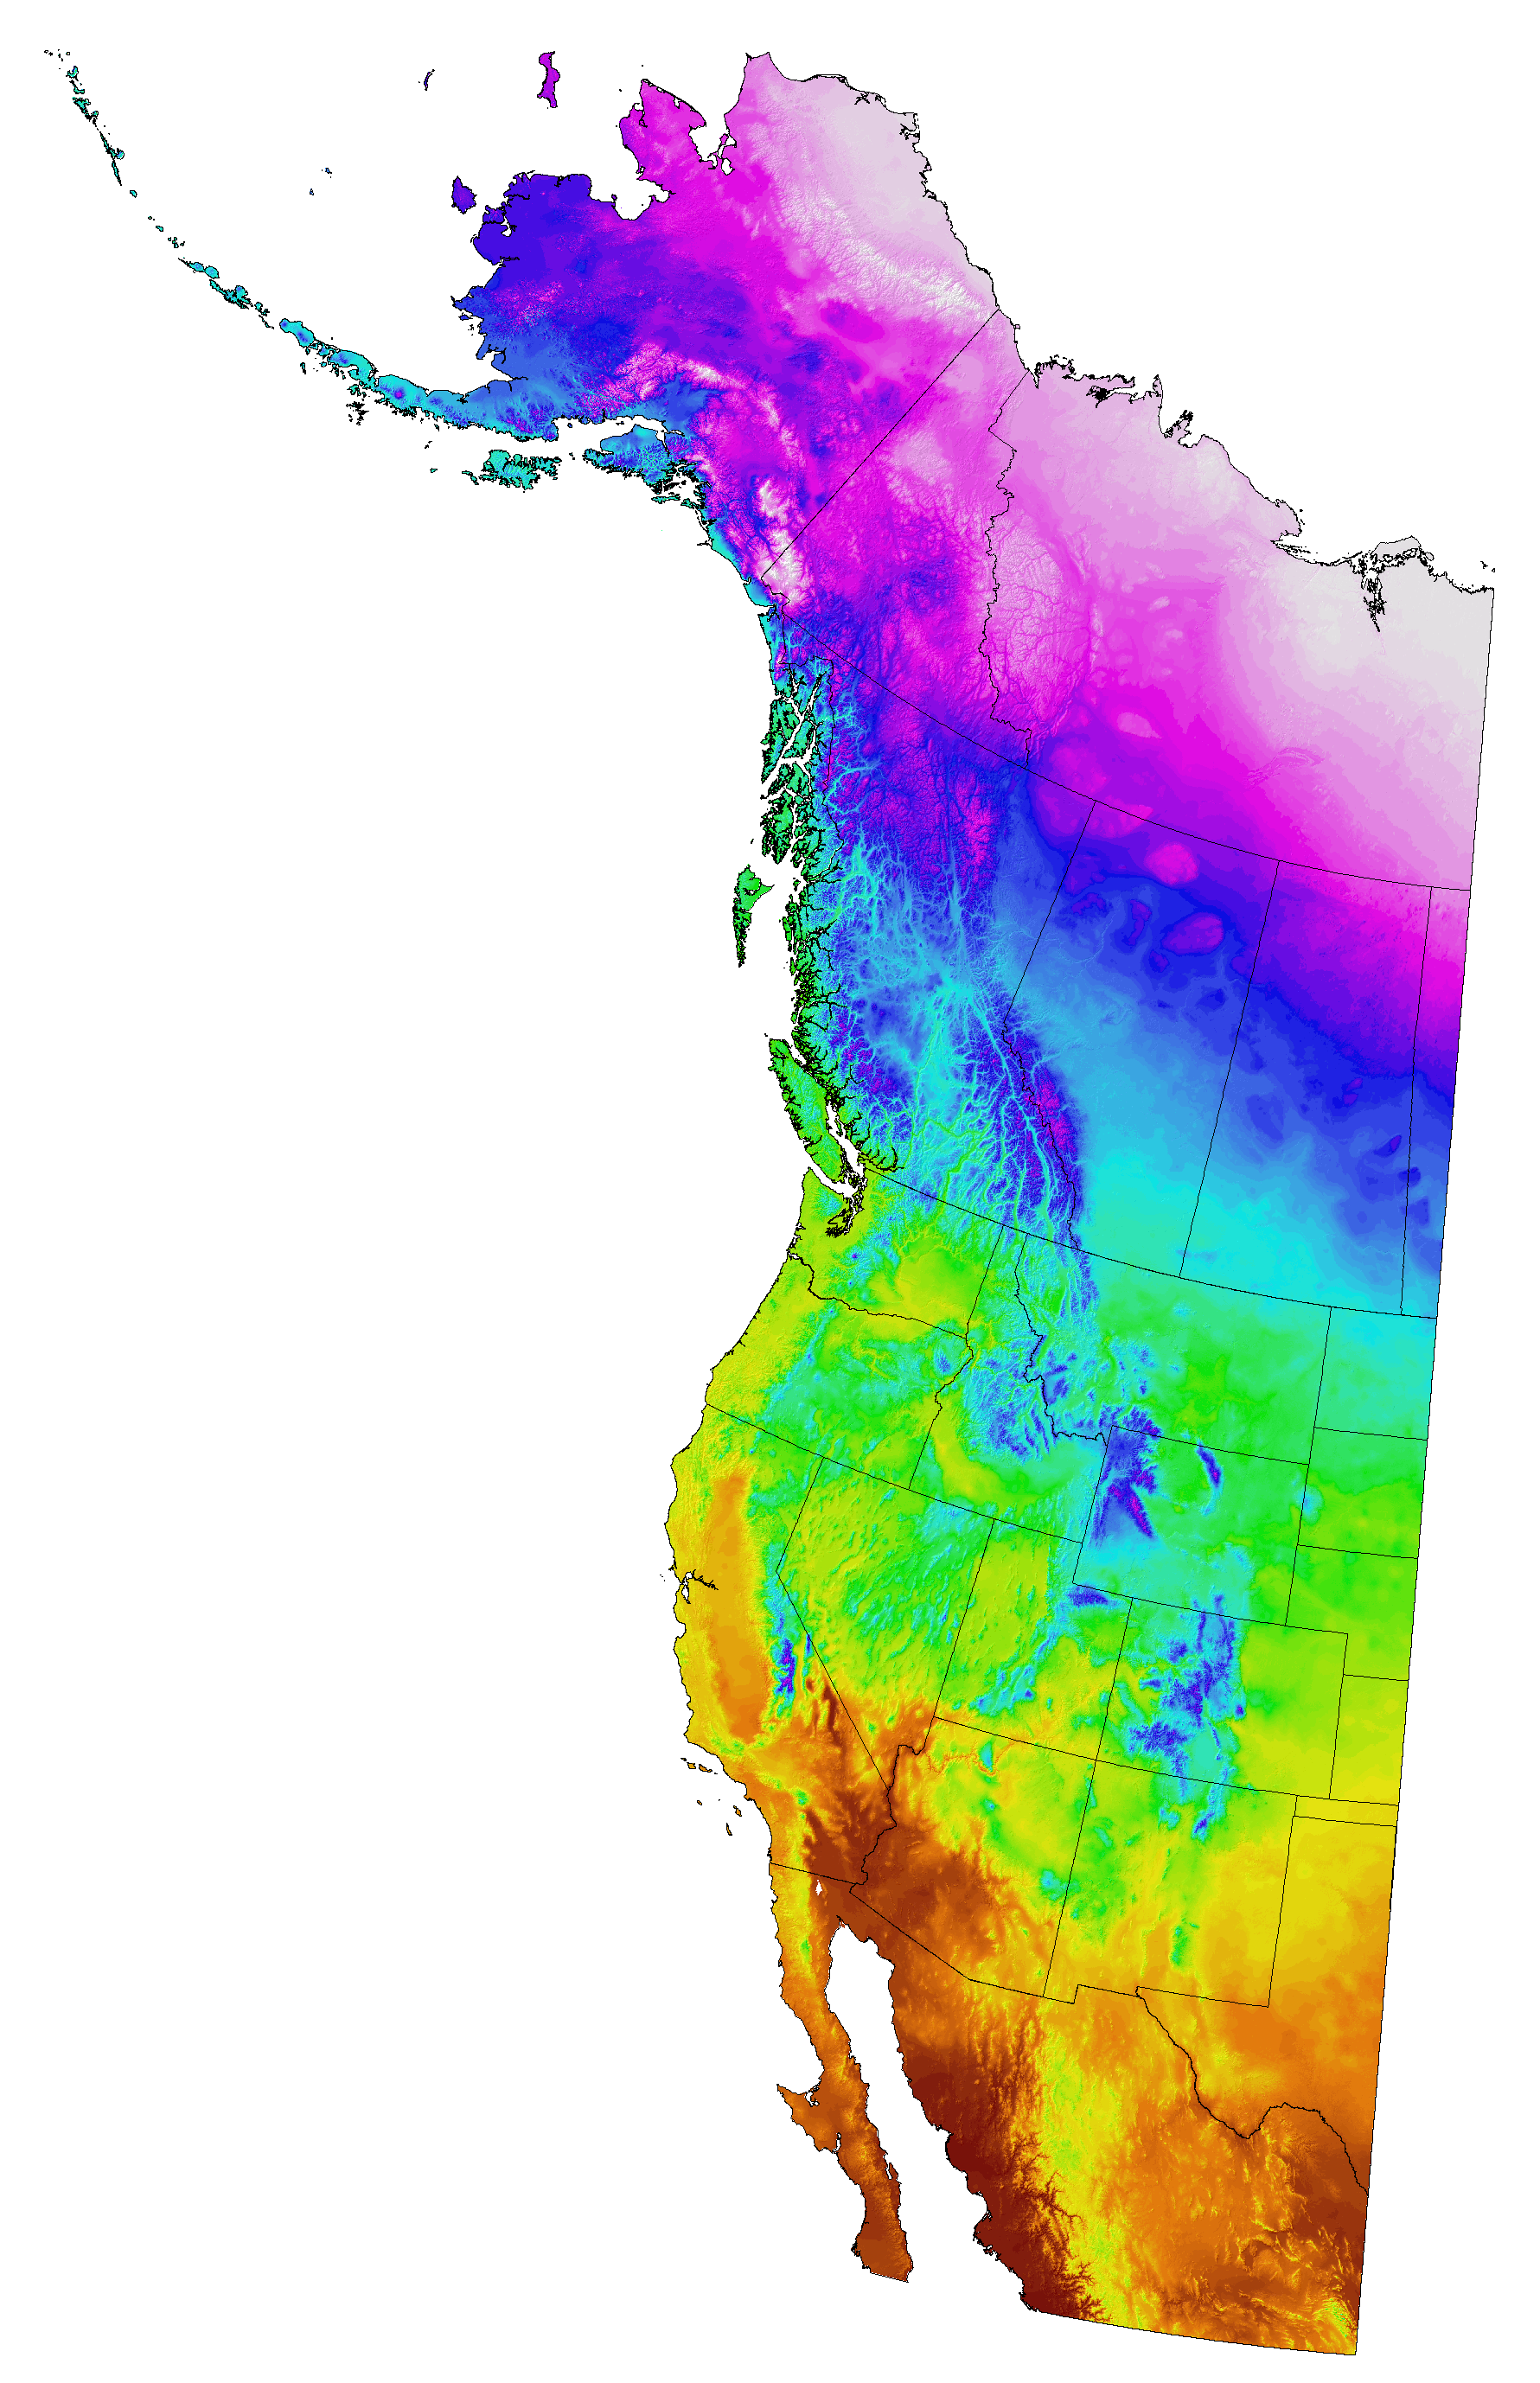
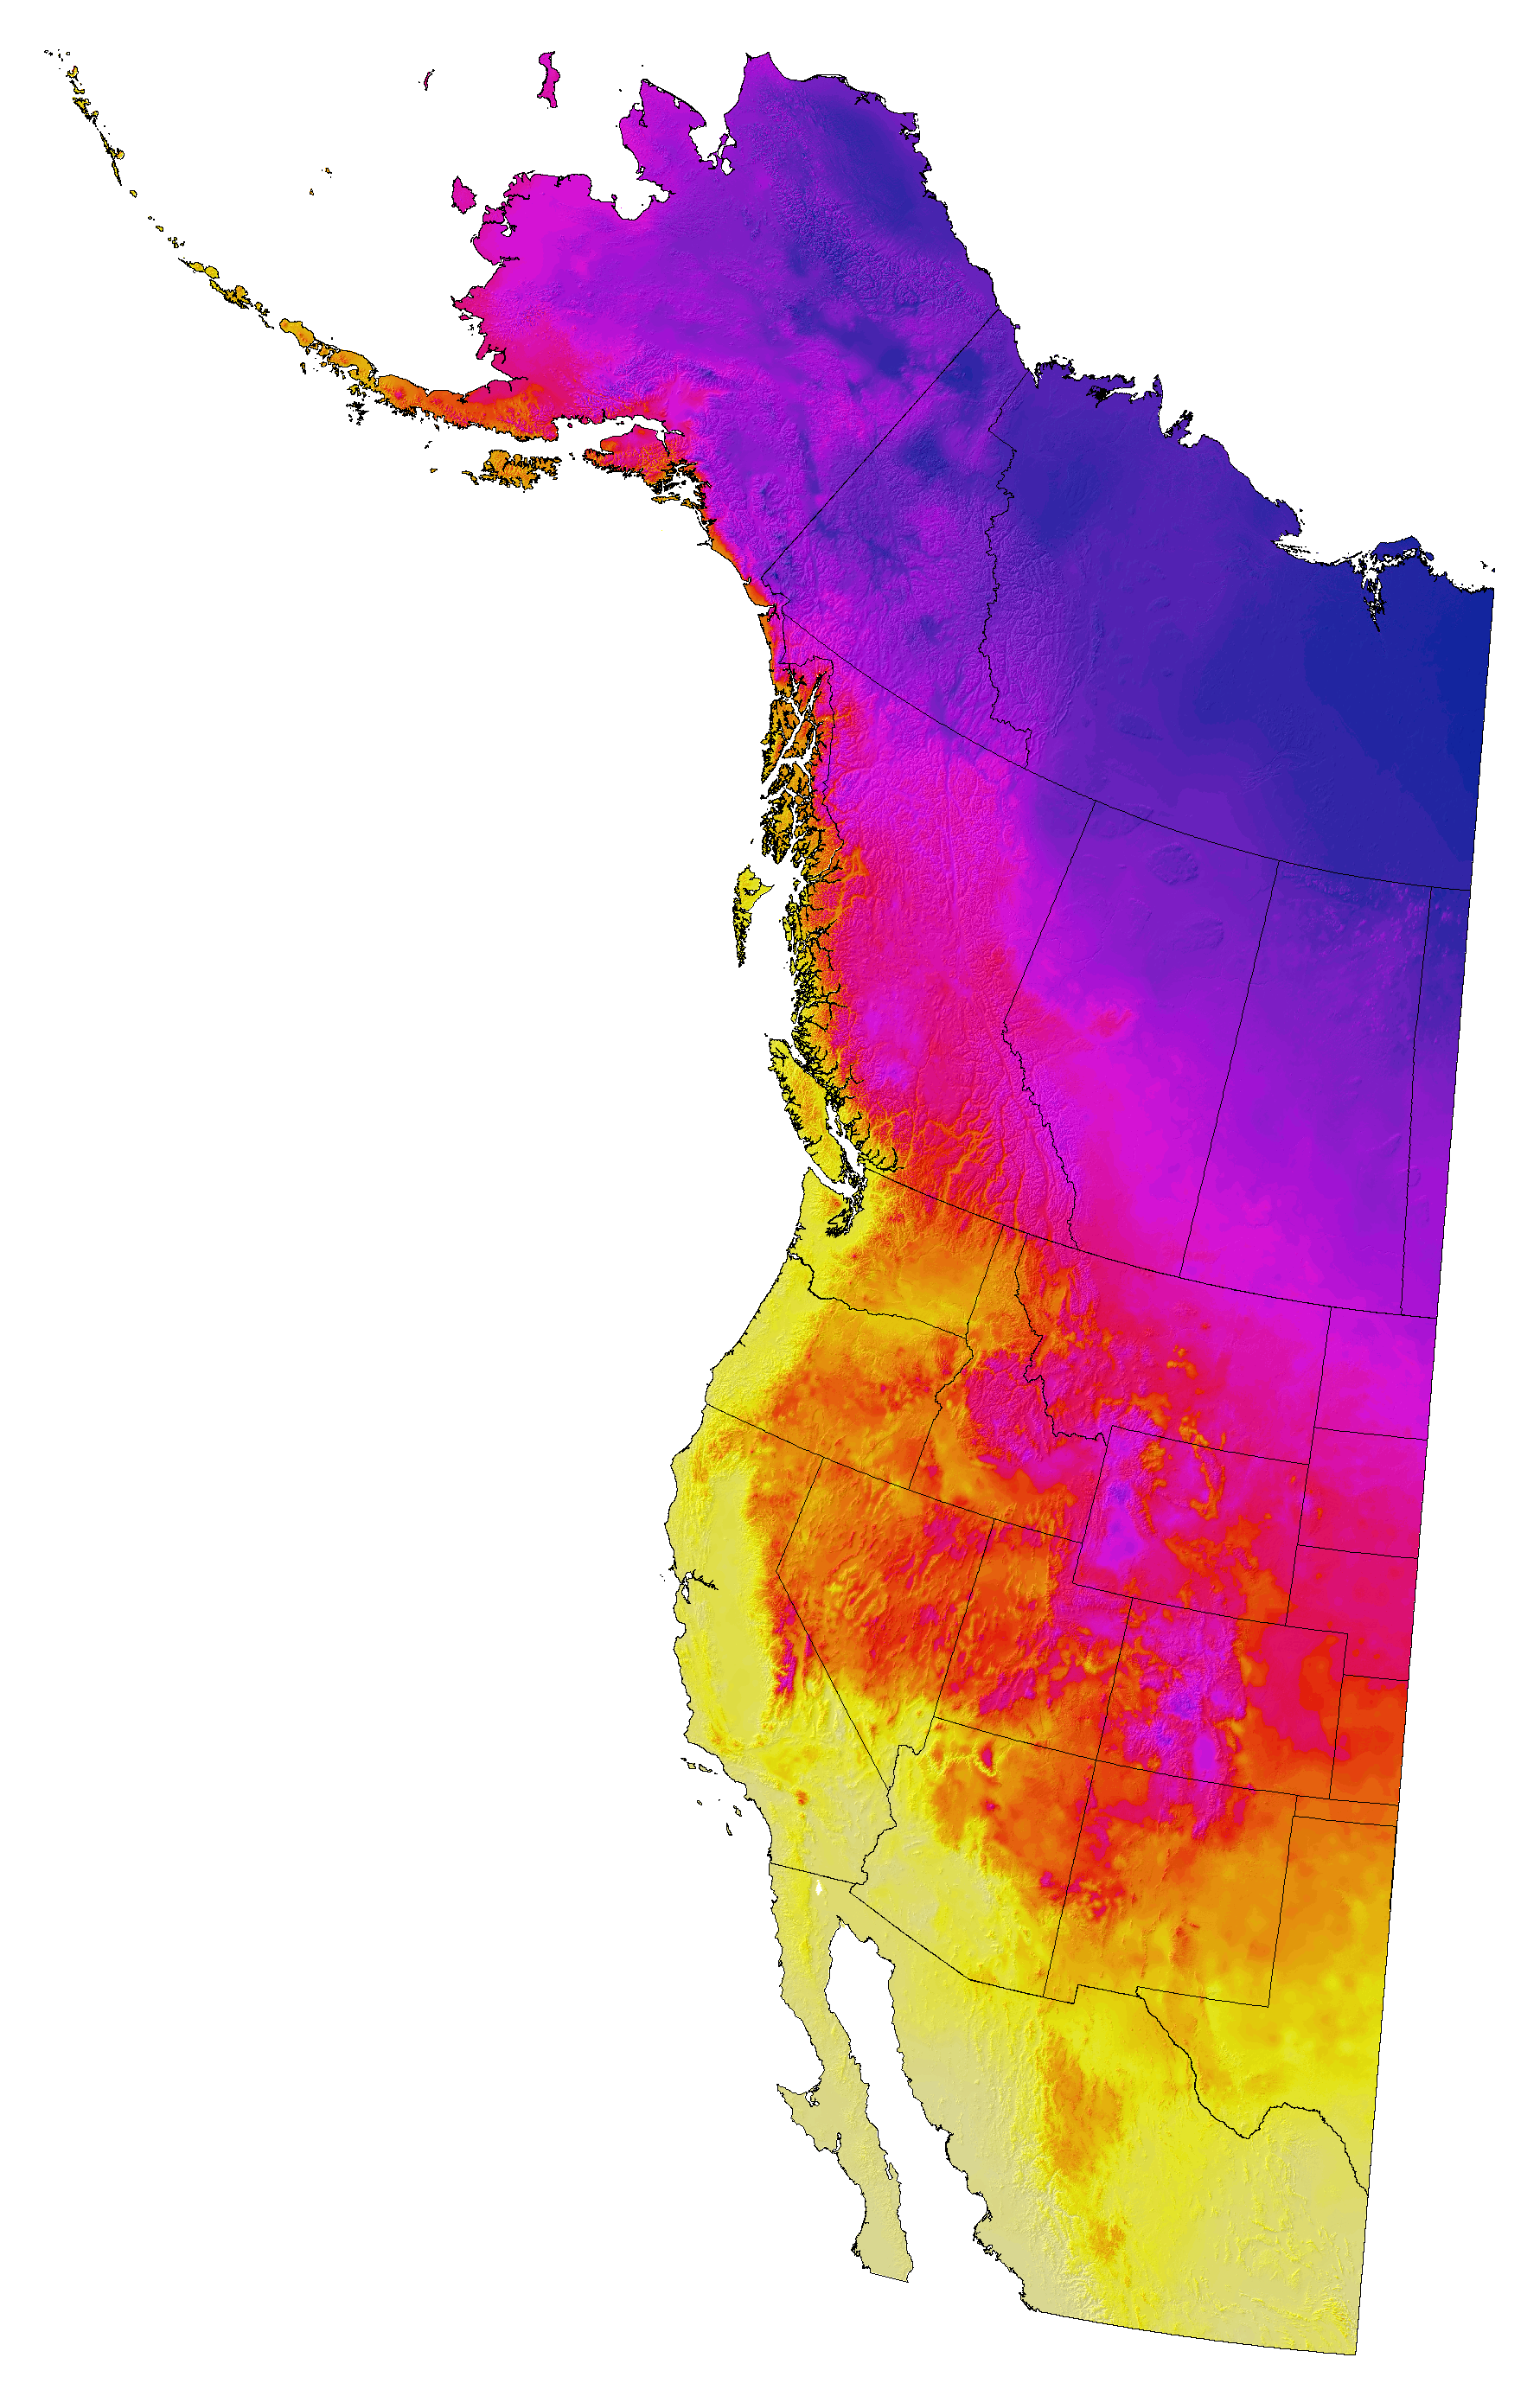
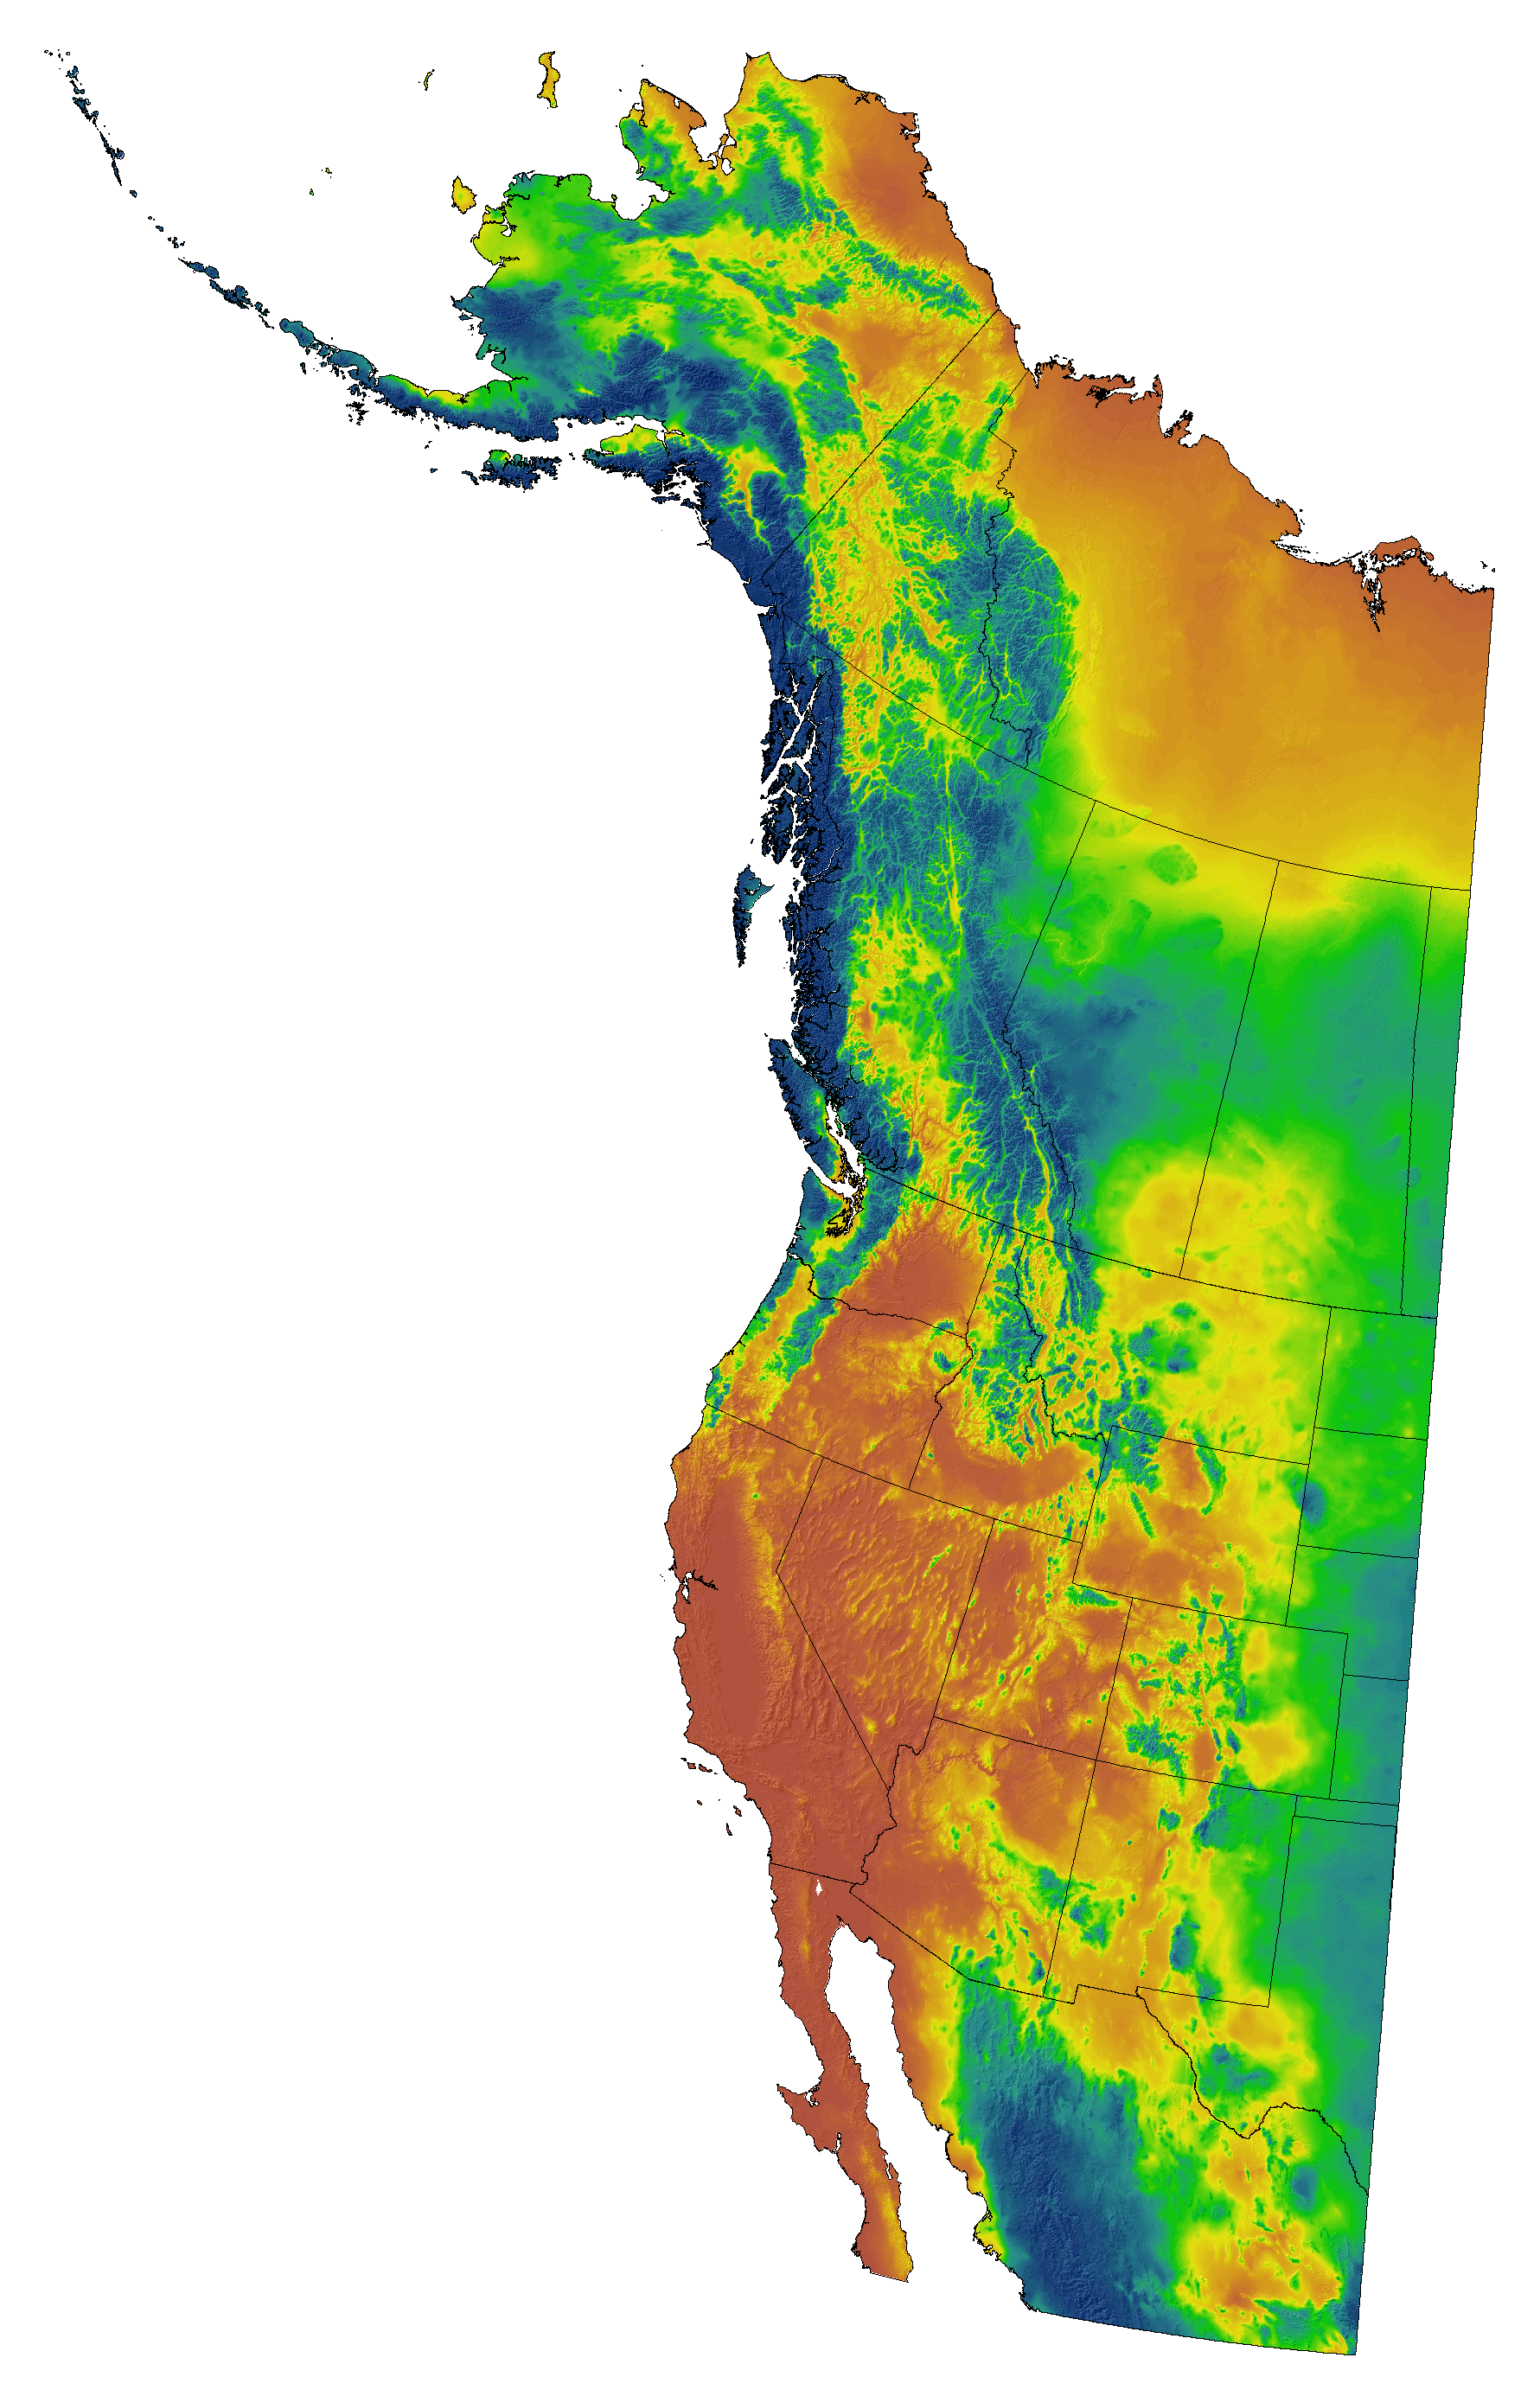
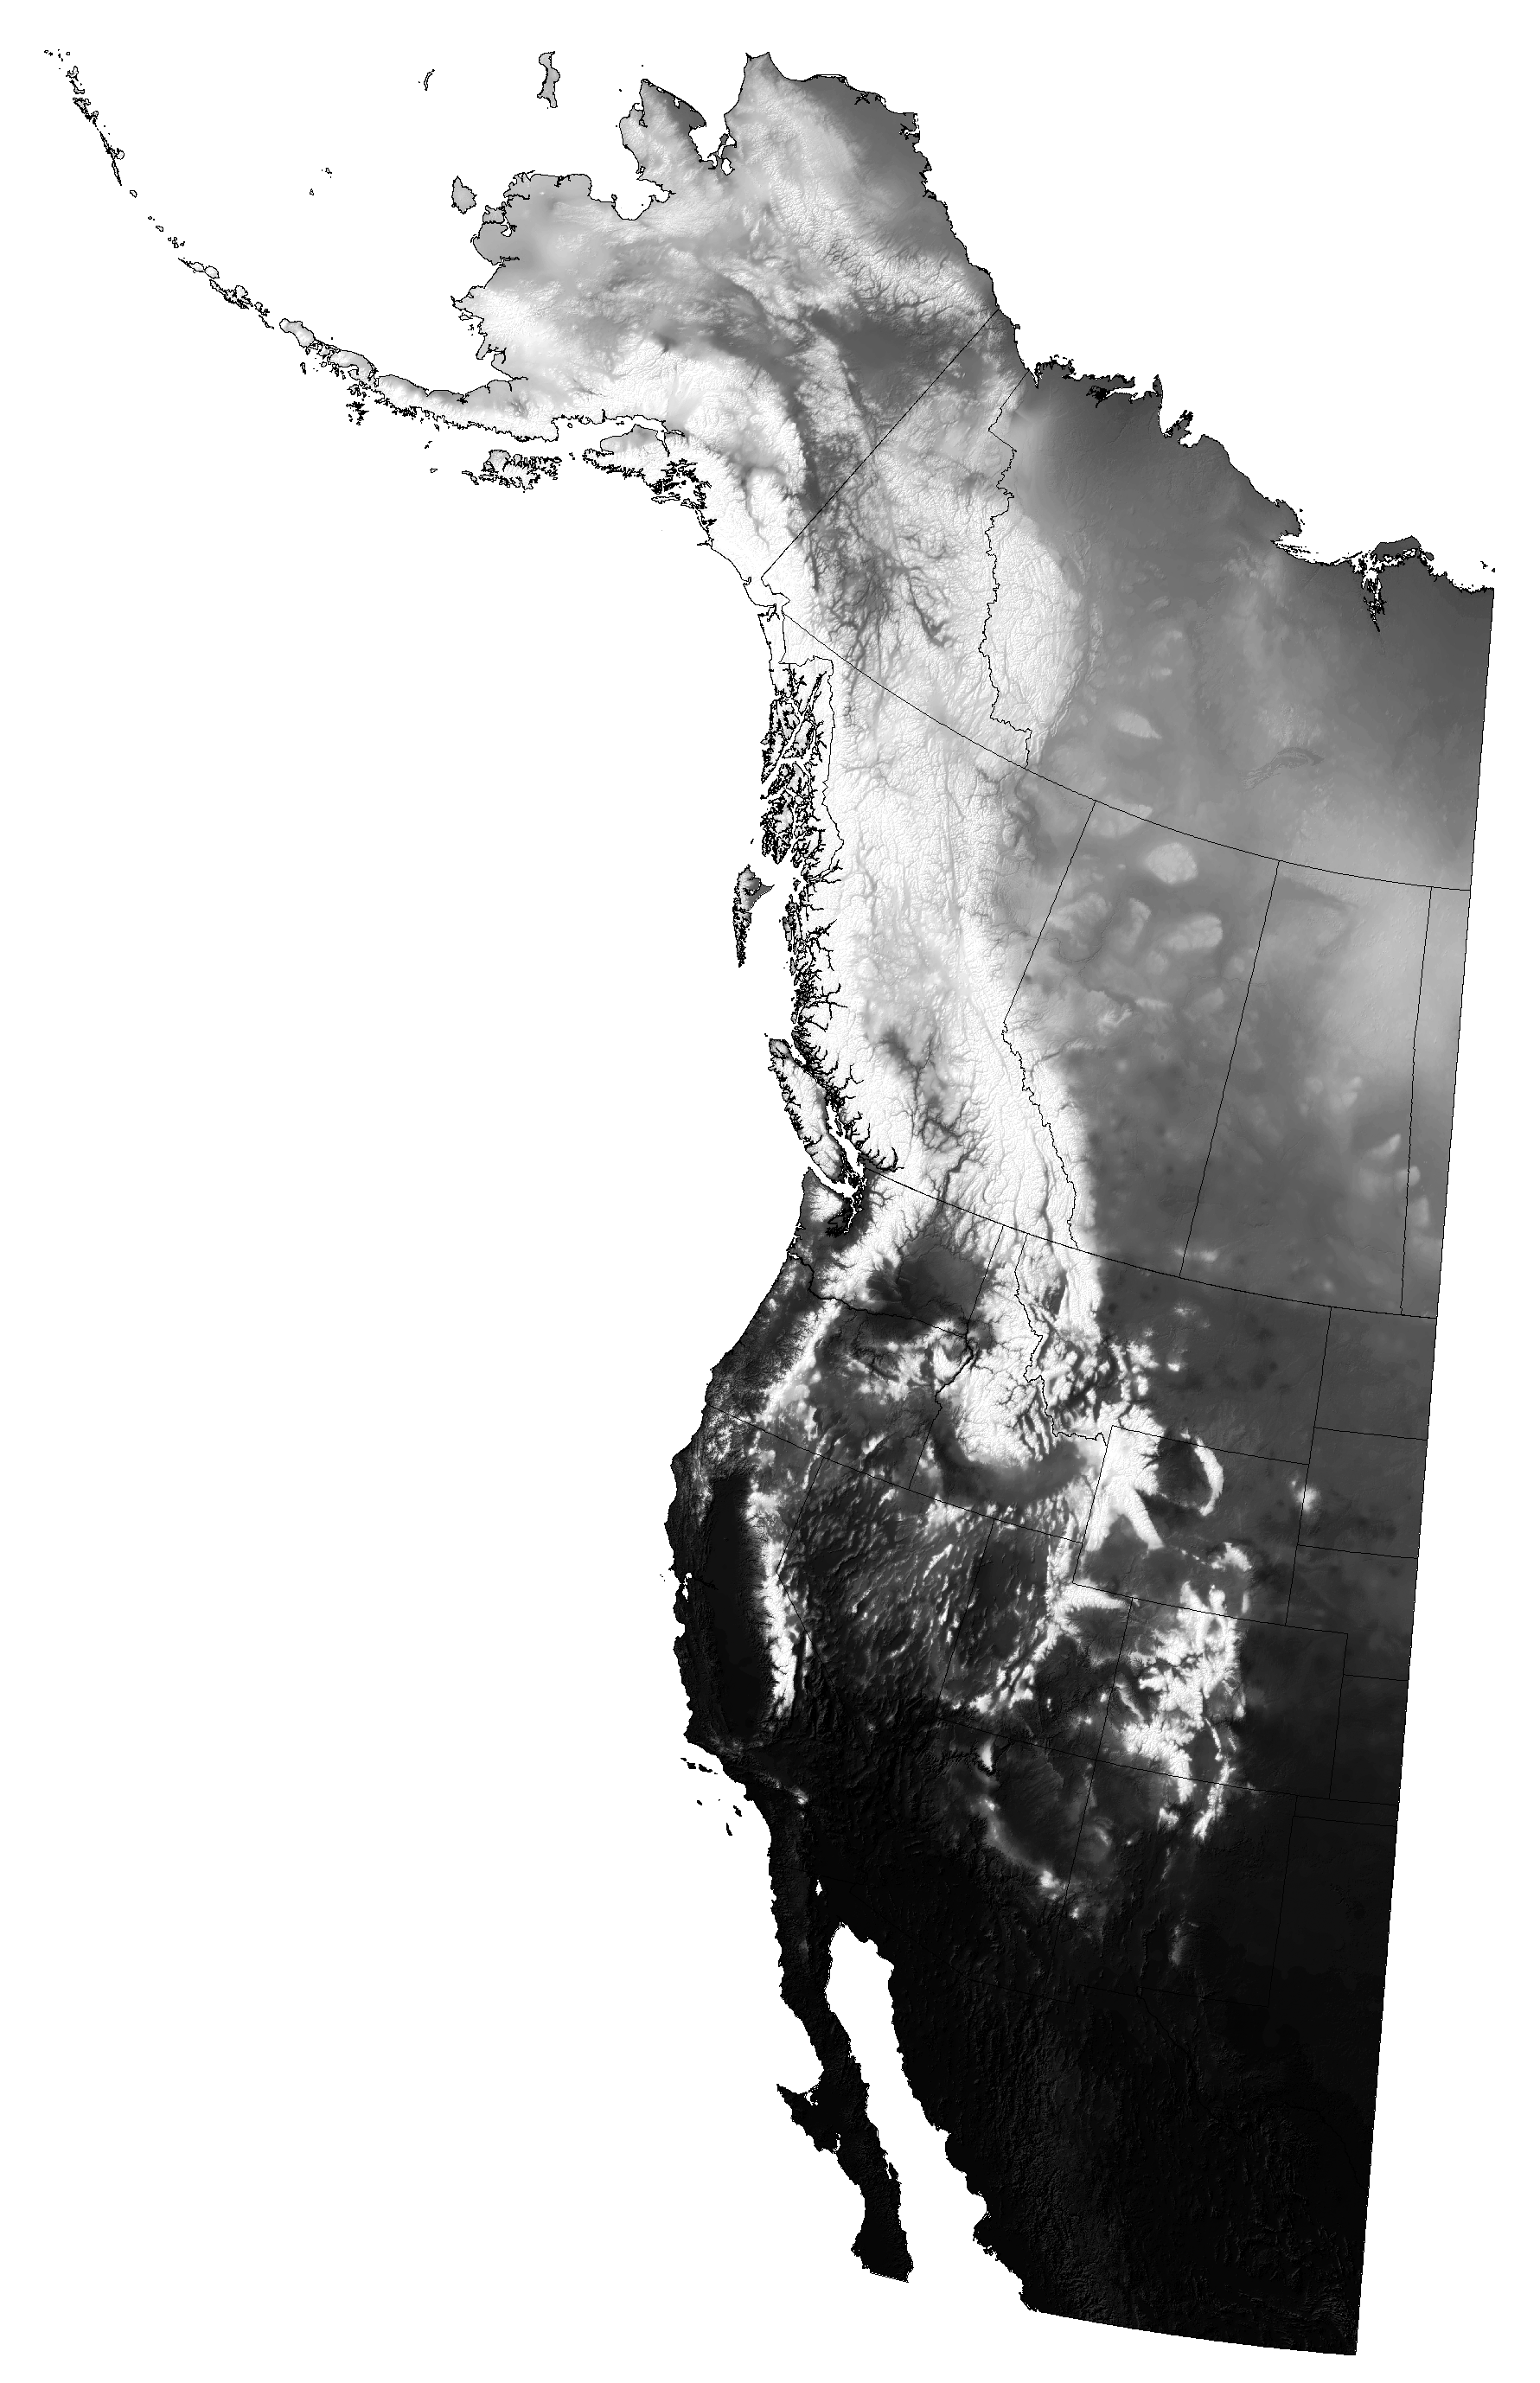
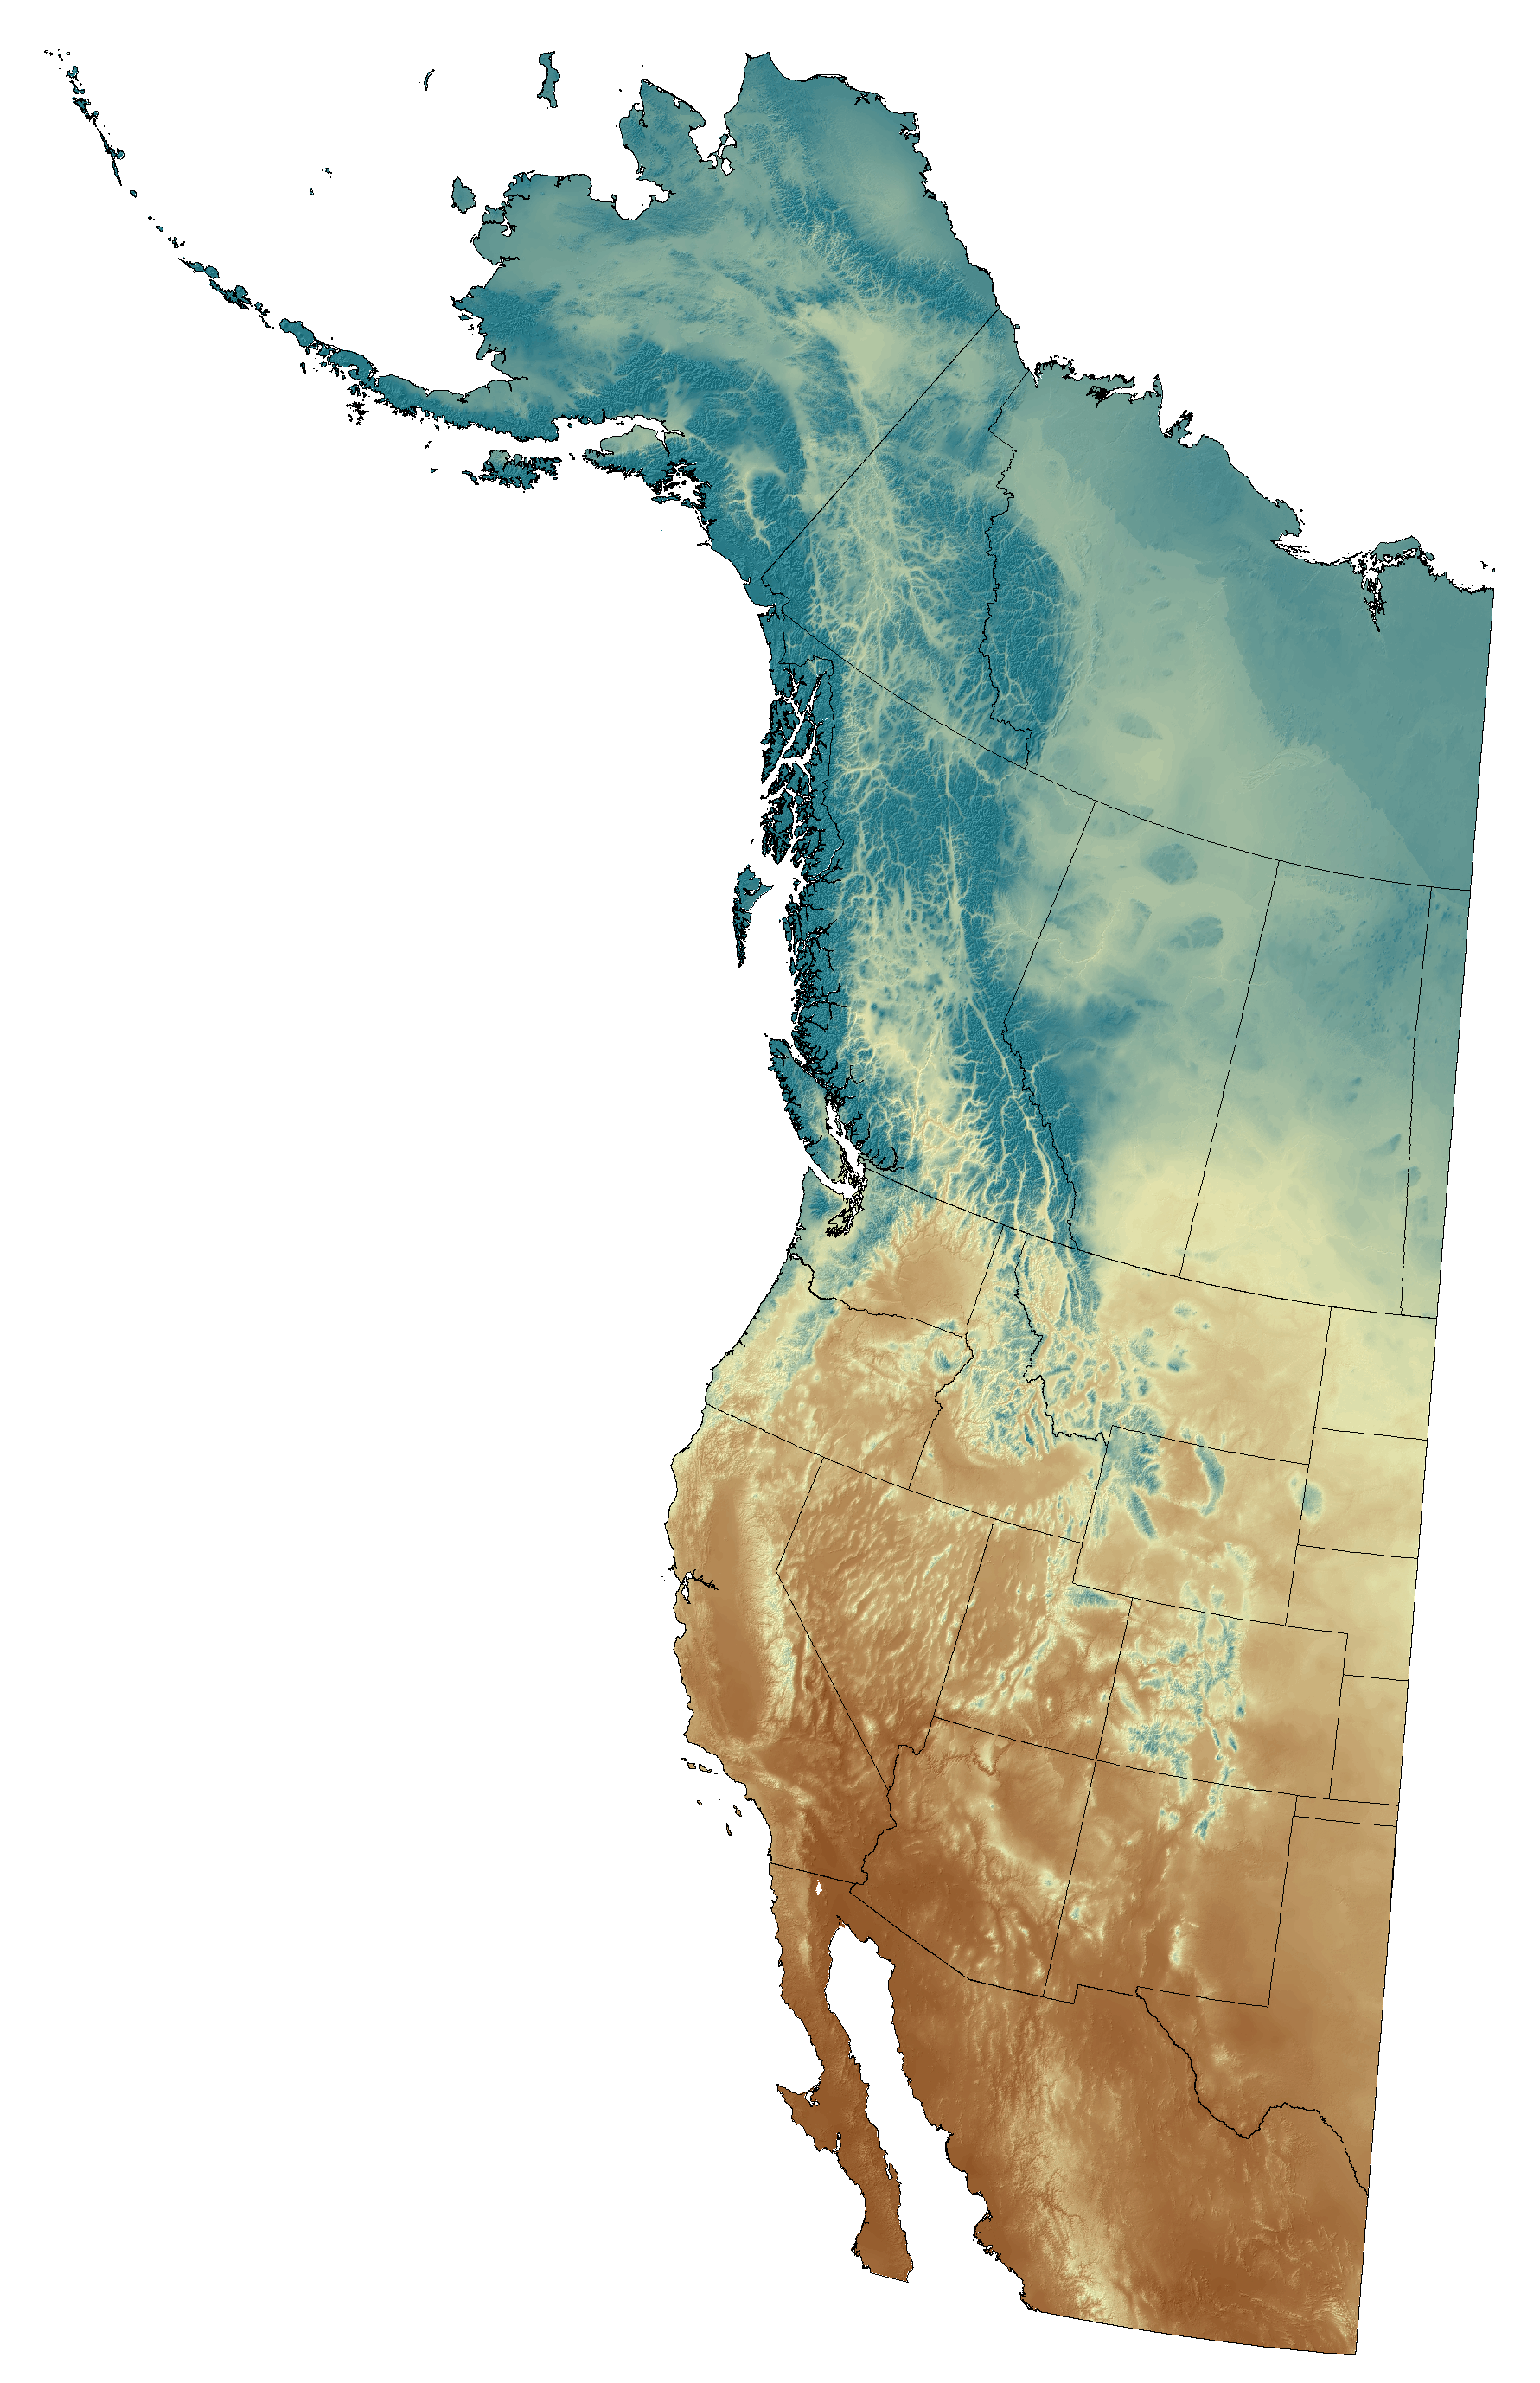
Click on the thumbnails below and use the zoom tool ![]() to see high resolution images of mean annual temperature (MAT), mean minimum January temperature with inversions in northern mountain valleys (Tmin01), mean summer preciptiation with leeward rainshadows (MSP), precipitation as snow (PAS), and Hargrave's climate moisture deficit (CMD):
to see high resolution images of mean annual temperature (MAT), mean minimum January temperature with inversions in northern mountain valleys (Tmin01), mean summer preciptiation with leeward rainshadows (MSP), precipitation as snow (PAS), and Hargrave's climate moisture deficit (CMD):
The reference climate grids are based on the Parameter Regression of Independent Slopes Model (PRISM) interpolation method for current climate. Historical data covers 1901-2020 are based on the CRU-TS 4.05 dataset (Harris et al, 2020, Scientific data 7: 109).
Future projections are based on 15 AOGCMs of the CMIP5 multimodel dataset corresponding to the IPCC Assessment Report 5 (2013) x 2 Emission Scenarios (RCP4.5 and RCP8.5) x 3 standard time-slices (2020s, 2050s, 2080s). Average projected global warming increase (and likely range) for RCP4.5 are: +1.4°C (±0.5) by the 2050s; +1.8°C (±0.7) by the 2080s. For RCP8.5 they are: +2.0°C (±0.6) by the 2050s; +3.7°C (±0.9) by the 2080s.
The 15 AOGCMs are CanESM2, ACCESS1.0, IPSL-CM5A-MR, MIROC5, MPI-ESM-LR, CCSM4, HadGEM2-ES, CNRM-CM5, CSIRO Mk 3.6, GFDL-CM3, INM-CM4, MRI-CGCM3, MIROC-ESM, CESM1-CAM5, GISS-E2R and were chosen to represent all major clusters of similar AOGCMs by Knutti et al (2013). Within clusters, we selected models that had high validation statistics in their CMIP3 equivalents.
Downloads and References
This program does not require installation. Download, unzip, and double click the executable file ClimateAB.exe. The program should run on all versions of Windows. If you receive the error message "COMCTL32.OCX missing", you have to install these libraryfiles. The program also runs on Linux, Unix and Mac systems with the free software Wine or MacPorts/Wine).

Reference usage like this: "Climate data has been generated with the ClimateWNA v4.62 software package, available at http://tinyurl.com/ClimateWNA, based on methodology described by Hamann et al. (2013)."

CMIP3 Climate grids at 1km resolution
The gridded climate layers downloadable below are in Lambert Conformal Conic projection, at 1km resolution, and covering North America, west of 100° longitude. The database consists of 11 million grid cells and is designed to capture climate gradients, temperature inversions, and rain shadows in the mountenous landscape of western North America.
There are two data formats available: All variables in a single comma seprated value file, where rows represent grid cell locations, and columns represent variables (CSV). CSV files can be read, for example, by R, SAS, or Excel. The other format are ESRI grids, a native format of ArcGIS software, but compatible with many other GIS applications (ASCII).
Two sets of variables are available for download. One comprises 24 biologically relevant variables, including seasonal and annual means, extremes, growing and chilling degree days, snow fall, potential evapotranspiration, and a number of drought indices. The second dataset consists of 36 monthly temperature and precipitation variables.
Although CMIP3 projections have been superseded by CMIP5, the two AOGCM generations yield remarkably similar projections (see Knutti and Sedlasek 2012). Therefore, the gridded climate data an and the well-tested software version below may still be used for some years to come. For gridded data of the latest CMIP5 projections, visit our ClimateNA page: http://tinyurl.com/ClimateNA.
Download links for climate data (1km resolution)
Note that these are older datasets hosted on a non-encrypted server, which triggers a security warning. The Chrome browser blocks the download links entirely, but you can use Microsoft Edge or Firefox to still download these files if you wish. Follow the > or ... link next to the security warning, then choose "allow download" or "download anyway".
24 Bioclimate variables (1961-1990 normal period) |
36 Monthly variables (1961-1990 normal period) |
Reference files: Elev, ID, Boundary |
Meta data: Projection, Variables |
|---|---|---|---|
| CSV: |
CSV: |
CSV: |
Readme: |
AOGCM name (country of origin, original resolution)1 |
Emission scenario2 | Future period3 |
24 Bioclimate variables |
36 Monthly variables |
|---|---|---|---|---|
CSIRO Mk3.0 (Australia, 1.87°x1.87°) |
A1B | 2020s | CSV: |
CSV: |
CGCM3.1 T47 (Canada, 3.75°x3.75°, CCCMA_CGCM_3_1) |
A1B | 2020s | CSV: |
CSV: |
ECHAM5 (Germany, 1.87°x1.87°, MPI_ECHAM5) |
A1B | 2020s | CSV: |
CSV: |
IPSL-CM4 (France, 3.75°x2.50°) |
A1B | 2020s | CSV: |
CSV: |
NCAR-CCSM3 (USA, 1.40°x1.40°) |
A1B | 2020s | CSV: |
CSV: |
UKMO-HadGEM3.1 (UK, 1.87°x1.24°) |
A1B | 2020s | CSV: |
CSV: |
MIROC3.2 hires (Japan, 1.12°x1.12°) |
A1B | 2020s | CSV: |
CSV: |
CSIRO Mk3.0 (Australia, 1.87°x1.87°) |
A1B | 2050s | CSV: |
CSV: |
CGCM3.1 T47 (Canada, 3.75°x3.75°, CCCMA_CGCM_3_1) |
A1B | 2050s | CSV: |
CSV: |
ECHAM5 (Germany, 1.87°x1.87°, MPI_ECHAM5) |
A1B | 2050s | CSV: |
CSV: |
IPSL-CM4 (France, 3.75°x2.50°) |
A1B | 2050s | CSV: |
CSV: |
NCAR-CCSM3 (USA, 1.40°x1.40°) |
A1B | 2050s | CSV: |
CSV: |
UKMO-HadGEM3.1 (UK, 1.87°x1.24°) |
A1B | 2050s | CSV: |
CSV: |
MIROC3.2 hires (Japan, 1.12°x1.12°) |
A1B | 2050s | CSV: |
CSV: |
CSIRO Mk3.0 (Australia, 1.87°x1.87°) |
A1B | 2080s | CSV: |
CSV: |
CGCM3.1 T47 (Canada, 3.75°x3.75°, CCCMA_CGCM_3_1) |
A1B | 2080s | CSV: |
CSV: |
ECHAM5 (Germany, 1.87°x1.87°, MPI_ECHAM5) |
A1B | 2080s | CSV: |
CSV: |
IPSL-CM4 (France, 3.75°x2.50°) |
A1B | 2080s | CSV: |
CSV: |
NCAR-CCSM3 (USA, 1.40°x1.40°) |
A1B | 2080s | CSV: |
CSV: |
UKMO-HadGEM3.1 (UK, 1.87°x1.24°) |
A1B | 2080s | CSV: |
CSV: |
MIROC3.2 hires (Japan, 1.12°x1.12°) |
A1B | 2080s | CSV: |
CSV: |
Ensemble of all 23 CMIP3 AOGCMs |
B1 | 2020s | CSV: |
CSV: |
Ensemble of all 23 CMIP3 AOGCMs |
B1 | 2050s | CSV: |
CSV: |
Ensemble of all 23 CMIP3 AOGCMs |
B1 | 2080s | CSV: |
CSV: |
Ensemble of all 23 CMIP3 AOGCMs |
A1B | 2020s | CSV: |
CSV: |
Ensemble of all 23 CMIP3 AOGCMs |
A1B | 2050s | CSV: |
CSV: |
Ensemble of all 23 CMIP3 AOGCMs |
A1B | 2080s | CSV: |
CSV: |
Ensemble of all 23 CMIP3 AOGCMs |
A2 | 2020s | CSV: |
CSV: |
Ensemble of all 23 CMIP3 AOGCMs |
A2 | 2050s | CSV: |
CSV: |
Ensemble of all 23 CMIP3 AOGCMs |
A2 | 2080s | CSV: |
CSV: |
2) B1: low emssion scenario, A1B: moderate emission scenario, A2: high emssion scenario
3) 2020s: average for years 2011-2040, 2050s: 2041-2070, 2080s: 2071-2100,
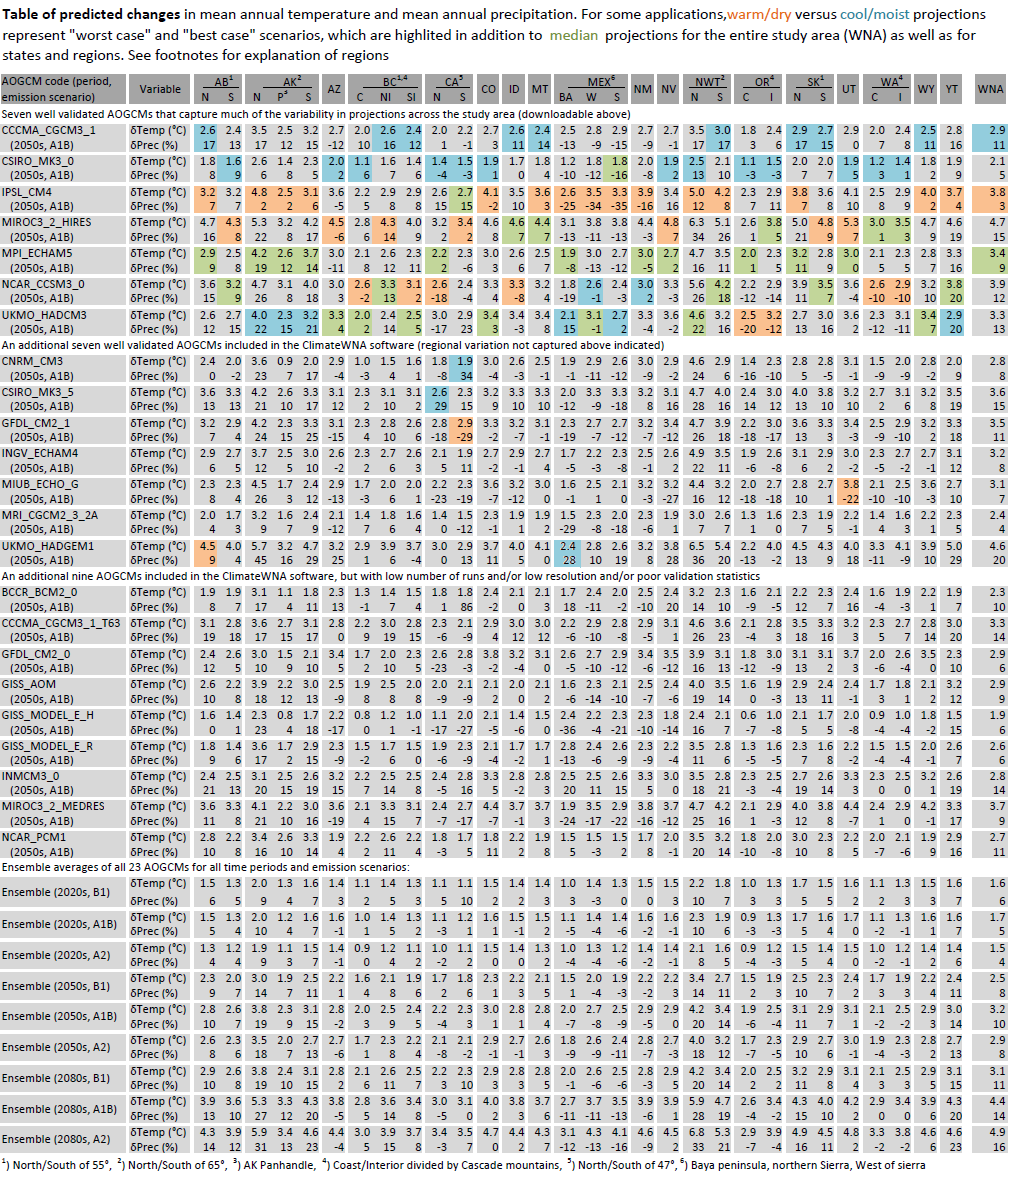
How to select future climate scenarios
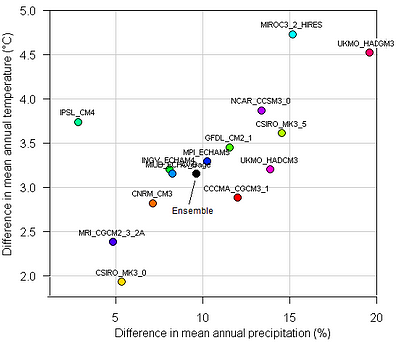
Selecting scenarios for climate change impact and adaptation research is a complex task. Not all future projections have equal resolution, number of runs, and validation statistics against past climate. We selected a representative set of 7 AOGCMs from 14 high-quality models, from a total of 23 CMIP3 AOGCMs. To further whittle the number of AOGCMs under consideration down, researchers often select "worst case", "best case", and "median" climate change projections. However, what constitutes a worst case or best case scenario, differs by region and by the climate variable of interest.
The plot on the right may help with scenario selection for the entire study area, and the table below for scenario selection for regions within western North America. We also provide ensemble scenarios for download above, but they may have unrealistic combinations of individual climate variables.