Andreas Hamann's website
RenR 480 - Experimental Design and Analysis (Fall Terms)

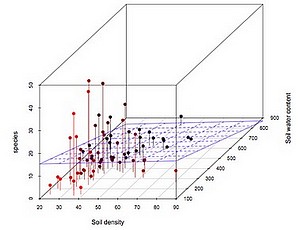
Aim: This course will provide you with an understanding of a wide variety of common statistical methods: tests for parametric, non-parametric, and binomial data; linear, non-linear and multiple regression.
Format: Informal, interactive lecture segments as well as hands-on learning using examples and a student project.
Software: You can choose between learning R or SAS (or both) to work through examples and to analyze your own data.
Target: New graduate students and senior under graduate students.
Sign up: Currently open for registration. Email amanda.brown@ales.ualberta.ca to register.
More info: For syllabus, website, and previous student’s projects click here.
RenR 603 - Graduate Research Skills (Fall Terms)

Aim: This course teaches academic survival skills for new graduate students. We cover everything from the administrative technicalities of the program, hands-on tips to be an effective researcher and communicator, to research ethics and philosophy.
Format: Seminar format with invited guest lecturers.
Target: New graduate students.
Sign up: Currently open for registration. You can register through beartracks..
More info: For syllabus and course website click here.
Format: Seminar format with invited guest lecturers.
Target: New graduate students.
Sign up: Currently open for registration. You can register through beartracks..
More info: For syllabus and course website click here.
RenR 690 - Applied Multivariate and Spatial Statistics (Winter Terms)

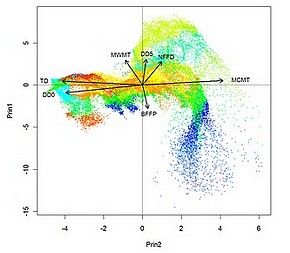
Aim: This course covers a wide variety of multivariate methods for analysis of community and environmental data: e.g. PCA, DA, MANOVA, MRPP, CC, CCA, Cluster Analysis, RA, CART, MRT, and we’ll try to work out any new methods.
Format: Project-based directed study using data from your MSc or PhD research. Weekly lectures and lab sessions on topics requested by students.
Software: I try to support any required software package but we will mostly use R.
Target: Senior grad students at the analysis stage of their research projects.
Sign up: Currently open for registration. Email amanda.brown@ales.ualberta.ca to register.
More info: For syllabus, website, and student’s projects click here.
R Graphics Crash Course

Aim: Stop fiddling with Excel and learn how to generate publication quality scientific graphs with R in a fraction of the time. We cover box plots, scatter plots, line plots, histograms, bar charts, dot plots, bubble plots and other types with a variety of customizations, such as overlay of functions, etc.
Format: Two 3 hr seminars in the computer lab with introductory lectures and time to work through a variety of exercises.
Target: Everyone, except those who take RenR 480 and 690 above, where this material is covered too.
Sign up: if you are interested email andreas.hamann@ualberta.ca.
More info: For more information and seminar materials click here.