

Data Collection
Barbed wire fencing was
installed in 2001 on both sides of an 800 m reach of the subject
watercourse to isolate the treatment area from cattle. Two
monitoring stations (one control, upstream, and one test, downstream)
were established in 2004. Grab samples of river water were
collected weekly (for chemical analyses) and every two weeks (for
bacterial analyses) from April until October, and then monthly during
the winter, from May 2004 through to December 2007. Temperature, pH,
electrical conductivity (EC), dissolved oxygen (DO), turbidity,
chlorophyll a were measured in the field using portable water quality
meters and associated probes.
My population of interest is
agricultural streams within cattle pastures in Southern Alberta.
However, due to cost limitations and availability of participating
landowners, my population for this project is limited to only one
stream within a cattle pasture in southern Alberta. To collect a
sample representative of my broader population of interest, I would,
ideally, have established replicates of my treatments on other
agricultural streams within the region; the data set I utilized for
this project was constrained to a comparison of a treatment reach and
control reach on a single stream.

Figure 5. Aerial photograph of the study site location.
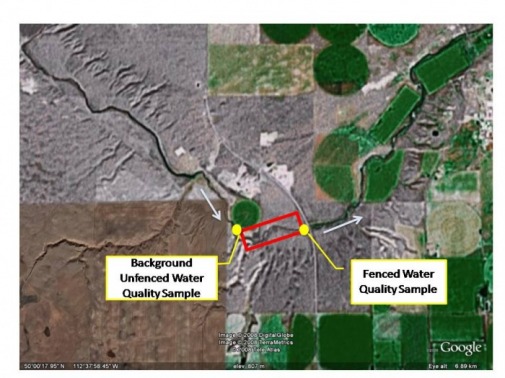
Figure 6. Relative location and layout of unfenced (upstream) and fenced
(downstream) treatments and sample collecion sites on the stream channel.
My sampling unit is my
sample stream reach and my experimental units are a suite of physical,
chemical and biological water quality parameters chosen to represent
water quality. My predictor variable is exposure to the riparian
fencing treatment, which is a categorical variable (Control = no fence,
Test = fenced). My complete set of response variables include 31
water quality parameters, of which only E.coli concentration is
discussed here.
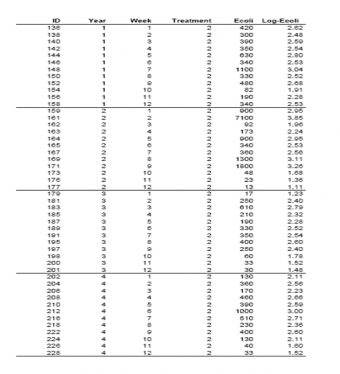
The following data table represents a subset
containing E.coli concentrations measured between June and the end
of October - the period when cattle are expected to utilize
adjacent pastures and when E.coli impacts to area watercourses are
anticipated. Selection of this time period also removed numerous
low values observed through winter and reduced the data spread.
Treatment 1 represents the fencing treatment, and Treatment 2, the
background water quality without fencing. E.coli
concentrations are given in Colony Forming Units per 100 milliliter
(CFU/100mL).
Table 1. E.coli concentrations
from the fencing (Treatment 1) and no-fencing (Treatment 2)
treatments between the first week in June and last week in
October, 2004 to 2007.

Verification
Before detailed
statistical analysis, graphical techniques, including scatterplots
(Figure 7), histograms and boxplots (Figure 8), were used to check
the complete, raw dataset for errors. In a large dataset, random
data entry keystroke errors can be present as can be systematic errors
in rounding or the use of significant figures. Some errors found
in this step included:
* Keystroke
Errors: extreme values represented by a misplaced decimal or group of
values multiplied by a factor of 10 or 100.
* Data Rounding: data recorded with unjustified significant figures
(e.g., decimal places beyond the precision of the original measure).
* Data Outliers: values that do not conform to the general pattern of a data set.
Extreme
values of E.coli (as represented by outliers) are possible,
biologically significant and of interest in the assessment of water
quality; as a result, all values were included in my analysis.
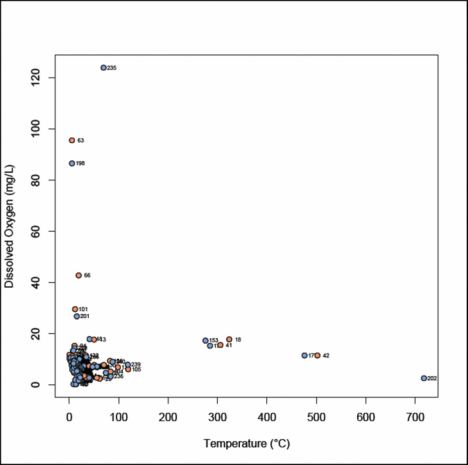
Figure 7. Example of scatterplot used to check for data errors in
the complete water quality dataset, comparing dissolved oxygen
measurements against recorded temperature. Data points are
labeled to assist with data corrections within the data set. Outliers
are visible as points outside the dense collection of data
(temperature < 30C, dissolved oxygen <15 mg/L).
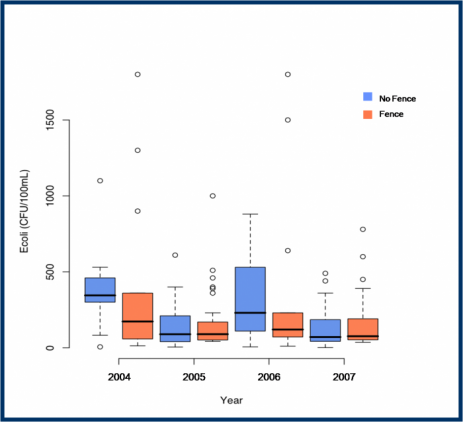
Figure 8. Boxplots comparing E.coli concentrations between
fenced and unfenced treatments across years, from 2004 to 2007.
Median values are indicated by the solid black bar and outliers are
represented by open circles.