Study
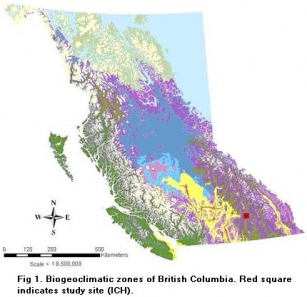
sites were located between kilometer 14 and kilometer 15 along the ice
road, 15 km's outside the town of Burton, B.C. Annual total
precipitation ranged from 900 to 1000 mm (25-50% falls as
snow), increasing with elevation. Annual air temperature ranged
from 2 to 4 ºC. All study sites had the same soils: Dystric Brunisol.
Average slope was 30% across the sites with micro-topograhical
attributes randomly dispersed.
In
September of 1996, target basal areas were selected at 25% and 50% of
the original stand (36 m2/ha). Trees were hand felled and skidded using
a 1987 Komatsu 37E crawler tractor. In April of 1998, 1 year-old,
container grown (1-0 PSB 313A) seedlings were planted.

Three retention levels (25%, 50% and 100%(control)) as a percentage
from the original basal area (36 m2/ha) were each randomly assigned to
one hectare treatment blocks (100m x 100m). The control was
replicated three times, while treatments were replicated twice.
Sixteen subplots (four rows of four) were assigned in each one
hectare treatment block. Subplots were systematically placed in
the middle each block and were 15 m apart (leaving a 20 meter
buffer on the edges). The middle two rows (2 rows of four) were
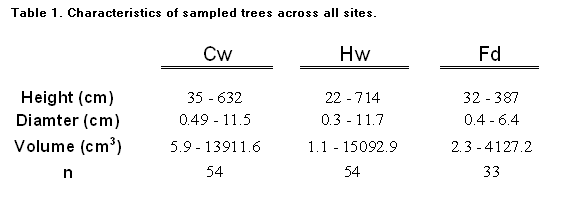
selected to reduce edge effect. One tree per species was selected
to be measured based on dominance and effect of residual trees within 4
m of the subplot center (Fig. 2). Measured tree characteristics are
summarized below (Table 1).
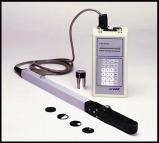
Light measurements were taken at each sample tree with a LAI 2000 Plant
Canopy Analyzer. Two measurements were taken (East and West) with 180
degree restrictors to avoid error with direct sunlight. Values were
compared to an open unit approximately 1 kilometer away and averaged to
get a full 360 degree indication of the light level and
competition. Diffuse Non-interceptance Light (DIFN) was
the estimator of light levels and Leaf Area Index (LAI) was
the estimator of competition.

Volume
equations were formulated using increment data from tree's growing
in the vasincity of the study area (less than 15
km's). Total height (cm) and diameters at 25 cm intervals for
trees less than 2 meters and 50 cm intervals for trees greater than 2
meters were taken for each species. Data was fitted to horner's
equations using Proc ALIN in SAS. Horner's equation has the following
form:
[1] Vol
= (D^a)/b-(c/Ht)
Where
Vol is the indivual tree volume (in cm3), D is
diameter (cm) at breast height when trees are greater than 2 m and
collar diameter (cm) when trees are less than 2 meters. Ht is the
height of the tree in centimeters, a,b,c are fitted parameters from
data set (Table 2). Growth reponse was determined by the percent
increase in volume to reduce co-variation of tree size.


(1i) Individual
species growth (continuous data) was compared across the
three levels of retention (categorical) using an ANOVA to determine if
retention level had an effect on growth. A data table (classed by
species) was created with retention level (categorical data) as
the predictor and growth (continuous) as the response. Tukey's pair
wise comparisons determined which rentention levels differed
in growth.
(1ii) The response of growth
between species within each rentention level was found
using an ANOVA. Three data tables were subseted for
each retention and classed by species. The means of each species
were compared with each other. Tukey's pair wise comparisons were used
to determine which species differed. Individual T-test's were used to
determine how much of a difference was found.
(2i) Light (%Full
sunlight) was compared across each retention level using a data table
that used retention level as the predictor variable and light as the
response variable. An ANOVA was used to determine the if a difference
existed. Light was categorized in 10% increments and ploted against the
percent found in each retention level.
(2ii)
Light environments were stratified into four distinct light
classes (width of 20% (categorical)) based on a percentage of full sun
(DIFN). A data table consisting of light class(classed by species) as
the predictor variable and percent increase in volume as the reponse
variable was constructed. In each light environment the three species
growth responses were compared with an ANOVA and subsequently
determined which species were different with Tukey's pair
wise comparisons.
(2iii) The reponse of species
growth (% increase in volume) was compared to the leaf area index
(contiunous variable), taken at each sample tree. Three logorithmic
equations were made and thresholds were determined based on
intersection of curves. Equations were made based on biologcial
understanding (logorithmic) and fitted using PROC NLIN in SAS.
Each equation had the following form:
[2] Percent
Increase in Volume = βo + β1*ln(LAI)
Significance was
determined at the 0.05 alpha level. All graphs were computed in R. All
statistical analyses were computed in SAS.

