 Habitat
loss and fragmentation are arguably the most important factors affecting global
biodiversity loss(1), but the combined effects
of such disturbances are poorly understood(2).
Although disturbances are often studied singly, there has been a growing interest
in examining the combined effects of multiple disturbances. This approach, which
has been termed cumulative effects assessment(3;4)
has become especially important in areas of heavy natural resource exploitation
such as the western Canadian boreal forest(5).
This region was, in recent history, largely free from human disturbance, but
has since become an area of rapid industrial, urban and agricultural expansion.
Thus, attaining biodiversity conservation goals in the western boreal forest
(and elsewhere) will no doubt require assessment of the cumulative effects of
multiple disturbances for both terrestrial and aquatic wildlife(2).
Habitat
loss and fragmentation are arguably the most important factors affecting global
biodiversity loss(1), but the combined effects
of such disturbances are poorly understood(2).
Although disturbances are often studied singly, there has been a growing interest
in examining the combined effects of multiple disturbances. This approach, which
has been termed cumulative effects assessment(3;4)
has become especially important in areas of heavy natural resource exploitation
such as the western Canadian boreal forest(5).
This region was, in recent history, largely free from human disturbance, but
has since become an area of rapid industrial, urban and agricultural expansion.
Thus, attaining biodiversity conservation goals in the western boreal forest
(and elsewhere) will no doubt require assessment of the cumulative effects of
multiple disturbances for both terrestrial and aquatic wildlife(2).
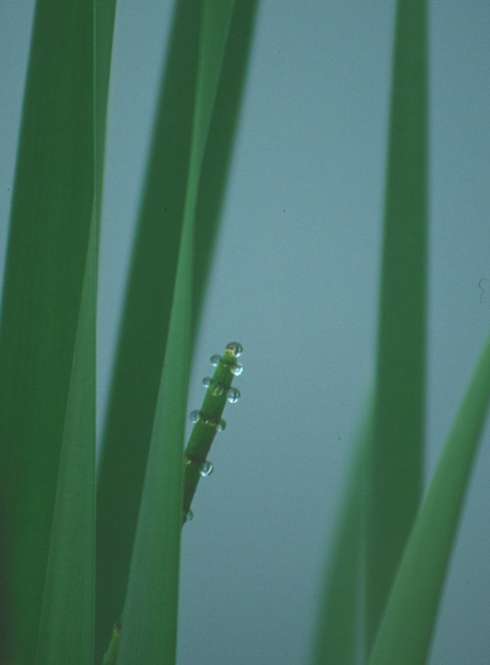
Patterns of wildlife diversity in the western boreal forest are, at least in
part, attributed to the habitat heterogeneity of the region. The western boreal
forest contains some of the highest densities of water and wetland habitats
in Canada, comprising as much as 20-50% of the landscape in some areas (Fig.
1). As a result, there are also abundant transition zones between water and
uplands called riparian areas(6). Riparian areas
often contain a higher diversity of plants and animals than either wetlands
or uplands alone(7;8) and may also contain species
not found elsewhere on the landscape. Consequently, riparian areas enrich regional
diversity (9).
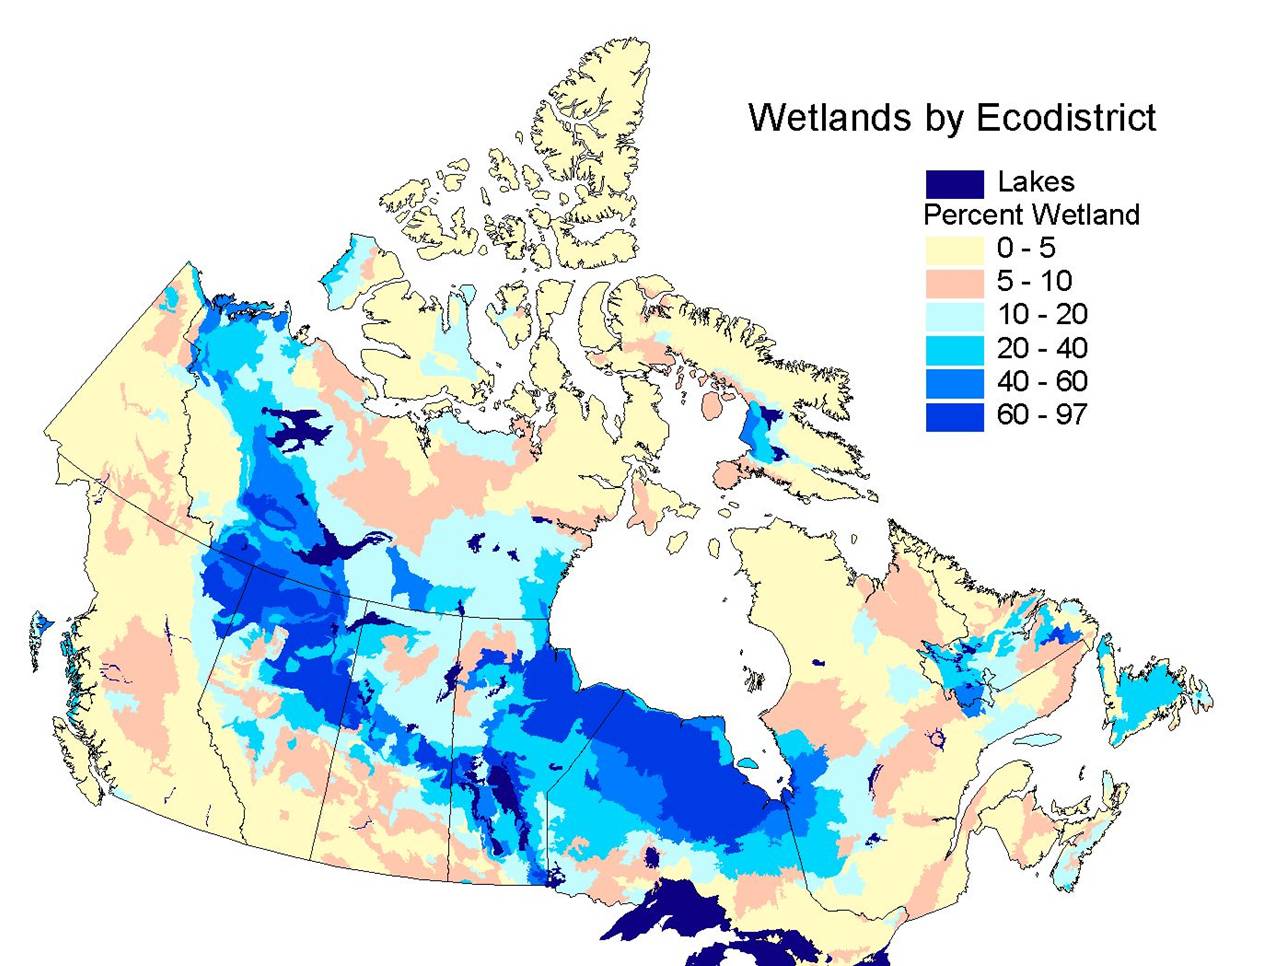
| Fig. 1. Percent cover by wetlands
by ecodistrict in Canada. Note the highest densities(40-90%) occur in the
boreal forest. In western Canada, cover is greatest in the boreal plain
ecozone outlined in red in Fig. 2 (Source: National Wetland Dataset,
Environment Canada). |
 |
Approximately 70-80% of boreal vertebrate diversity is represented by birds,
which occupy a broad range of habitat types and represent a number of functional
groups in both aquatic and terrestrial habitats(10).
Birds are also sensitive to habitat alterations at local and landscape scales
and are relatively straightforward to monitor(4;11;12).
Thus birds are well suited for testing effects of multiple disturbances on boreal
wetlands and riparian areas(4).
To investigate the effects of multiple disturbances on riparian- and wetland-associated
bird communities, I chose to examine community composition and compositional
variability (species turnover). Community composition was examined along a continuous
scale by Non-metric Multi-dimensional Scaling (NMS)(13;14).
NMS constructs a representation of samples, in n-dimensions and attempts to
satisfy all the conditions of the rank dissimilarity matrix (14).
The algorithm endeavors to minimize stress, which results from finding balance
between dimensions needed to represent the sample points and maintaining the
rank order of the dissimilarity matrix. NMS is nonparametric and is therefore
well suited to data that are non-normal and on potentially discontinuous scales(13).
NMS also permits the use of any distance measure, including Sørensen
or Bray Curtis measures, which are often recommended for community data. In
the present study, neither the bird data nor the environmental data were normally
distributed (Secondary Analysis) and the
relationships among variables could not be assumed to be linear. Moreover, examinations
of a number of different disturbances could potentially result in discontinuous
gradients. Therefore, NMS was determined to be the best method for graphical
representation of the bird communities examined (13;14).
To examine changes in compositional variability, I used the routine MVDISP
(PRIMER) to calculate relative dispersion and an Index of Multivariate Dispersion
(IMD)(15). An IMD is used to contrast the average
rank of dissimilarities among 2 groups of samples, a treatment and a control.
IMD has a maximum value of +1 when dissimilarities among sites within a treatment
are higher than among controls. A value between 0 and -1 implies no difference
between groups. Blocks were assigned to disturbance groupings a priori in order
to examine treatment effects categorically (Secondary
Analysis). MVDISP also returns the average dispersion (define) for each
group. An increase in relative dispersion reflects an increase in compositional
variability among sites within a group(15).
Both procedures were selected because they are consistent in their use of
Bray-Curtis similarity/dissimilarity measures and thus results can be directly
related to one another. NMS was carried out using PC-ORD 4.0. Dispersion calculations
were carried out PRIMER. Tests of normality (Kolmogorov-Smirnov) and homogeneity
of variances (Levene’s test) were carried out in STATA version 8.0.
Community composition was measured by counting birds at each of 5 wetlands
contained within a total of 75, 25 km2 blocks in the boreal plains
ecoregion of north-eastern Alberta, Canada (Fig. 2a).
Blocks were selected along 2 gradients of low to high disturbance: industrial
and agricultural (Figs. 2a and 2b). We surveyed
all birds detectable at a wetland using a combination of protocols that was
intended to measure as much of the riparian- and wetland-associated community
as possible(16-18) (Bird
Survey Protocols). For this paper each community metric was considered at
a landscape scale (species data combined data for each block). The vegetation
attributes and total disturbance were calculated using GIS (Secondary
Analysis).
Since agricultural conversion results in the greatest habitat loss relative
to other disturbances, I predicted that it would also result in the greatest
change in community composition. An NMS that included all 75 blocks in one analysis
supported this prediction, but was visually difficult to interpret for all disturbances
combined. I therefore conducted two separate NMS analyses, one using only sites
along an agricultural gradient and another for sites along an industrial gradient.
A total of 85% of the variance in species composition among blocks was represented
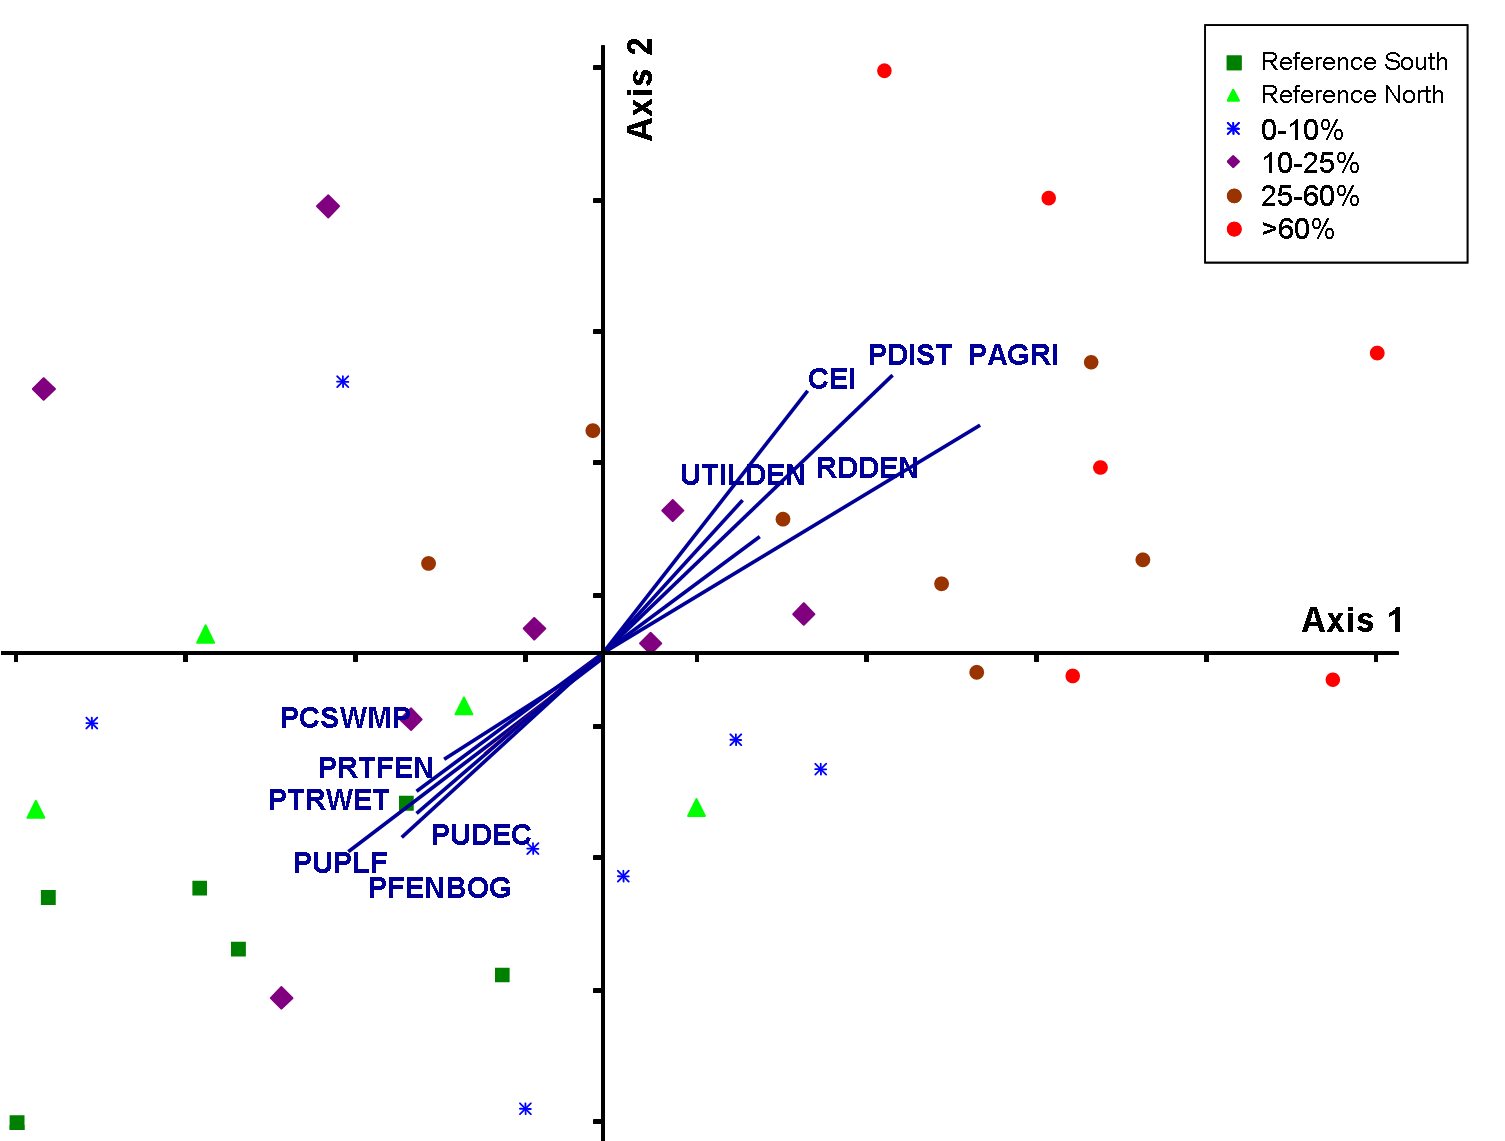
by the ordination diagram resulting from the agricultural analysis (Fig. 3).
Subsequent overlays of environmental variables illustrate that birds are responding
to a loss of native vegetative cover including a decrease in cover of upland
forest and treed wetlands (Fig. 3a). While a description of the response of
individual species to each disturbance gradient is beyond the scope of this
paper, species in agriculture-dominated sites tended to be generalists and early
successional species (Fig. 3b). Species dependent on tree cover (e.g., cavity
nesting ducks, Winter Wren) occurred at the opposite end of the gradient.
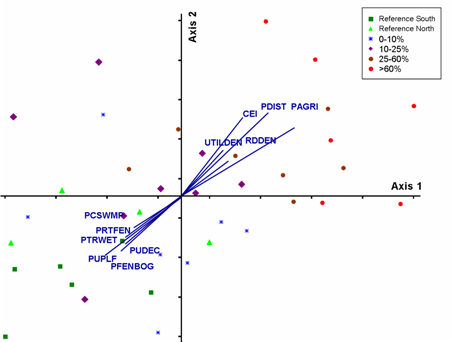 |
Fig.3a) NMS for agricultural gradient with species removed.
Ordination diagram represents 85% of the variance in community composition
among 25 km2 blocks (Stress=15.63; Axis 1= 45%; Axis 2=40%).
Species data were log transformed to represent overly abundant species and
less common species more equally. Similar ordinations were obtained using
presence absence and raw abundance values. Overlays represent environmental
values measured using GIS (Secondary Analysis).
Abbreviations for environmental variables are described in Table
2. Colors and shapes of symbols represent categories by percent of agricultural
disturbance. Click graphic to see larger version. |
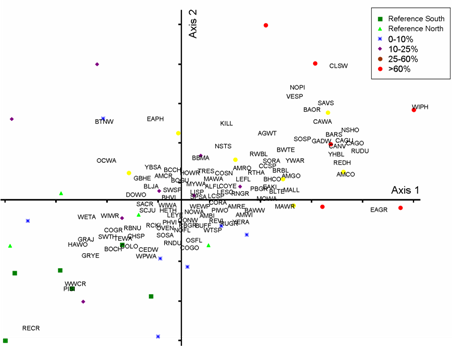 |
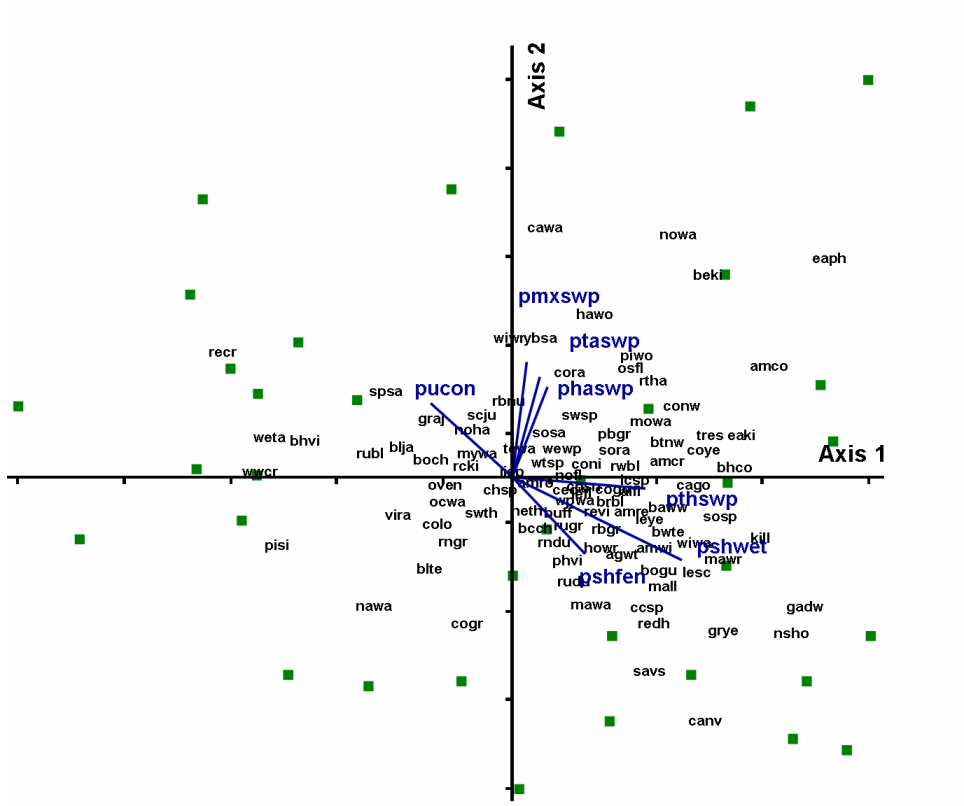
Fig. 3b.) Results of same NMS analysis as in 3a. with bird species represented
by 4 letter American Ornithological Union Codes. Species codes, common names
and scientific names of bird species are included in Table
1. Colors and shapes of symbols represent categories by percent of agricultural
disturbance. Click graphic to see larger version. |
Linear disturbances such as roads, seismic lines and utilities tend to result
in greater habitat fragmentation than loss, thus I expected effects on the bird
community to be more subtle. The NMS analysis containing only industrial disturbance
showed a strong distribution of sites that seemed related to habitat variables,
notably proportion of treed wetlands and of shrub-dominated wetlands (Fig. 4).
In contrast to the agricultural gradient, I found very little community response
to landscape disturbance at this scale (Fig.4).
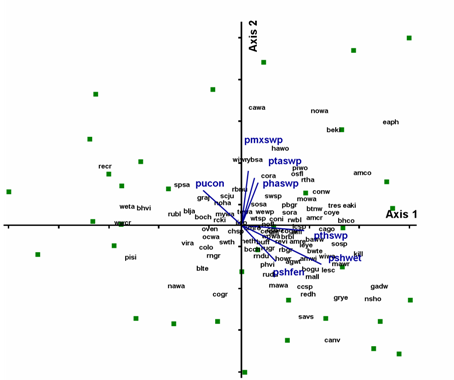 |
Fig.4. NMS diagram for species composition of blocks selected
to represent a gradient of industrial landscape disturbance. NMS permits
resizing of symbols to reflect a continuous scale of disturbance. There
was no pattern for any individual disturbance, nor for all industrial disturbances
combined. Bird species are identified using four letter American Ornithological
Union Codes. Species codes, common names and scientific names of bird species
are included in Table 1. Based
on overlays of habitat variables birds appear to be responding to landscape
availability of tree- and shrub-dominated wetland types.bbreviations for
environmental variables are described in Table
2. Click graphic to see larger version. |
I predicted that the variability of bird communities would change in accordance
with the spatial heterogeneity hypothesis(19).
That is, the highest level of dispersion, a measure of species turnover, would
occur at some intermediate level of disturbance and decrease toward opposite
ends of the disturbance gradient. Indeed, compositional variability was highest
at intermediate levels of total landscape disturbance (Fig 5d). This pattern
was also found for individual disturbances in all cases except forest harvesting,
where average dispersion was greatest at the highest end of the disturbance
gradient measured (Fig 5a-5f). In contrast, the IMD did not show any consistent
patterns. However, this finding is not surprising given that the highest level
of dispersion was predicted for intermediately disturbed sites rather than for
the highly disturbed sites.
 |
| Fig. 5. Multivariate dispersion for
increasing levels of disturbance.a.) agriculture, b.)
cumulative effects index c.) %harvested d.)
% total disturbance e.) road density(km/km2)
for industrial portion of study area and f.) road density(km/km2)
for portion of study area most affected by agriculture. Dispersion was calculated
among blocks of a given disturbance grouping. Patterns observed above also
held when calculated among wetlands of a particular disturbance grouping,
and when using raw data, presence absence data, or as pictured here, using
log transformed data. |
Cumulative effects of disturbance are generally considered to be difficult
to predict(21), especially for communities,
but these effects can be described and quantified. While effects of agriculture
on boreal riparian- and wetland-associated bird communities were clear in this
study, effects of industrial activity were not evident using NMS. One possible
reason for this difference is that the disturbance gradient used was shorter
(less total intensity) and therefore changes may not have been of sufficient
magnitude to be detected. The maximum total disturbance (habitat loss) among
these sites was only 30%. Thus, despite having sampled the most intensively
disturbed areas in Alberta’s boreal forest, bird community effects of
these disturbances were not evident at this scale.
Another potential contributing factor is time since disturbance. Many of the
disturbances in the landscapes chosen for this study are less than 10-20 years
old. A study of wetland vertebrate species in Ontario cautioned that species
showed a delayed response to roads(22) and that
declines were only evident after longer periods of time had passed since roads
were built. In addition, effects of industrial activity may not yet be detectable
at the landscape scale suggesting that analysis at the wetland scale is necessary
to confirm whether community effects are truly absent. Finally, while counts
of birds are considered a reasonable approximation of habitat suitability, other
potential impacts of disturbance such as decreased breeding or nesting success
or increased predation due to fragmentation were not directly examined. However,
other studies that have examined these questions more closely in upland boreal
forest have also noted the absence of strong fragmentation effect for boreal
upland bird communities(23; 24)
Another indirect method of community stress is an increase in variability in
response to disturbances. Some authors have described an increase in compositional
variability with disturbance (e.g., marine benthic communities(15)),
while others have predicted or described a homogenizing effect(21).
These two opposing predictions may reflect the extent of the disturbance being
examined. For example, conversion to agriculture increases habitat heterogeneity
(and subsequently compositional variability) until the proportion of agriculture
on the landscape increases to such a degree that habitat heterogeneity actually
declines(20). Small pulses of disturbance may
also result in an increase in variability, while continuous disturbance may
eventually result in homogenization of community composition(19).
Although variability is a natural component of biological communities, large
fluctuations (either positive or negative) in community composition and compositional
variability and their implications for biodiversity conservation warrant further
study.
Reference List
1. L. Fahrig, Biological Conservation 100, 65-74 (2001).
2. G. Niemi et al., Conservation Ecology 2, 17- (1998).
3. A. D. Syphard and M. W. Garcia, Wetlands 21, 342-353 (2001).
4. M. J. Croonquist and R. P. Brooks, Environmental Management 15, 701-714 (1991).
5. R. R. Schneider, Alternative Futures: Alberta's Boreal Forest at the Crossroads
(The Federation of Alberta Naturalists; The Alberta Center for Boreal Research,
Edmonton, Alberta, ed. 2002).
6. B. L. Ilhardt , E. S. Verry, B. J. Palik, in Riparian management in forests
of the continental eastern United States, E. S. Verry, J. W. Hornbeck, A. Dolloff,
Eds. (Lewis Publishers, Boca Raton, Florida, 2000).
7. R. J. Naiman, H. Decamps, M. Pollock, Ecological Applications 3, 209-212
(1993).
8. K. A. Harper and S. E. Macdonald, Ecology 82, 649-659 (2001).
9. J. L. Sabo et al., Ecology 86, 56-62 (2005).
10. K. A. Hobson , D. A. Kirk, A. R. Smith, Ecoscience 7, 267-280 (2000).
11. V. Saab, Ecological Applications 9, 135-151 (1999).
12. J. W. Lichstein, T. R. Simons, K. E. Franzreb, Ecological Applications 12,
836-857 (2002).
13. B. McCune and J. B. Grace, Analysis of ecological communities (MjM Sofware
Design, Gleneden Beach, Oregon, 2002).
14. K. R. Clarke, Australian Journal of Ecology 18, 117-143 (1993).
15. R.M. Warwick and K.R. Clarke, Change in Marine Communities: an approach
to statistical analysis ans interpretation (Plymouth Marine Laboratory, PRIMER-E,
ed. 2001).
16. C. J. Conway, "Standardized North American marsh bird monitoring protocols"
2002).
17. D. S. Dobkin and A. C. Rich, Journal of Field Ornithology 69, 430-443 (1998).
18. S. S. Rosenstock, D. R. Anderson, K. M. Giesen, T. Leukering, M. F. Carter,
The Auk 119, 46-53 (2002).
19. K. Shea, S. H. Roxburgh, E. S. J. Rauschert, Ecology Letters 7, 491-508
(2004).
20. A. Holzkamper, A. Lausch, R. Seppelt, Ecological Modelling (In Press).
21. L. D. Harris , Environmental Management 12, 675-693 (1988).
22. C. S. Findlay and J. Bourdages, Conservation Biology 14, 86-94 (2000).
23. F. K. A. Schmiegelow, C. S. Machtans, S. J. Hannon, Ecology 78, 1914-1932
(1997).
24. C. S. Findlay and J. Houlahan, Conservation Biology 11, 1000-1009 (1997).
25. I. D. Thompson, J. A. Baker, M. Ter-Mikaelian, Forest Ecology and Management
177, 441-469 (2002).
26. I thank Erin
Bayne and Keith Hobson for help on this project including study design and
statistical analysis. I thank Tyler
Cobb for comments on early drafts of this paper. Andreas
Hamann put considerable effort into developing RENR-501, the course for
which this paper was developed. I am grateful for the financial support provided
by the Sustainable Forest Management Network,
Western
Boreal Conservation Initiative, Ducks
Unlimited Canada, Alberta Conservation
Association and the University
of Alberta. Data for analysis was provided by the Integrated
Landscape Management Project, Ducks
Unlimited Canada and Alberta Pacific Forest
Industries. I am also grateful to Kevin Kardynal, Maureen Wetsch, Steven
Smith, Sara Bumstead, Coleen Stevens, Lisa Flaman, Sean Haughian, and Lawanda
Stern for braving the bears, countless biting insects and backcountry ATV adventures
to collect field data.