|
|
|
|
 |
|
 |
| |
Cover Type Effect, Species Richness Comparisons:
The comparison of estimated species richness as determined through individual based rarefaction showed a clear difference in the number of individuals collected between the conifer and the deciduous dominated cover types (Figure 1). Within the deciduous dominated sites there was a clear separation between the edge treatment and the intact and clear-cut treatments when compared at approximately 180 individuals (Figure 1). The edge treatment represented the highest species richness, whereas the clear-cut and intact forest treatments had the same species richness (Figure 1). Within the conifer dominated sites there was greater separation between the treatments when compared at approximately 60 individuals (Figure 1). The clear-cut treatment possessed the highest species richness, with the edge treatment and intact forest treatment having progressively lower species richness estimates (Figure 1).
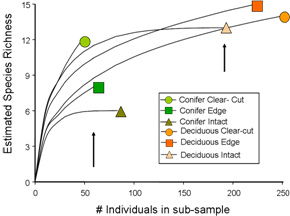
Figure 1: Individual based rarefaction comparing estimated species richness between the clear-cut, edge (0 meter), and inact (105 meter) treatments of both conifer and deciduous dominated sites. Black arrows represent common abundance to all treatments within each cover type where comparisons should be made.
|
|
 |
 |
 |
|
|
|
|
|
|
|
|
|
| |
Cover Type Effect: Multivariate Comparisons:
The dendrogram produced by the hierarchical clustering analysis demonstrated a clear difference in community composition between the conifer and deciduous cover types as was demonstrated by the first split in the tree (Figure 2). Within the conifer treatments, we see the clear-cut, 0, and 15 meter treatments grouping out separately from all the other sites along the edge gradient (Figure 2). The 15 meter site then branches off of the 0 meter and clear-cut treatments lower down the dendrogram (Figure 2). Within the deciduous dominated sites a similar pattern is evident but only the clear-cut and 0 meter treatments group out separately from the remaining edge gradient treatments (Figure 2). In addition we see a closer similarity of the 15 meter site to the sites further away from the forest edge (Figure 2).
|
|
| |
|
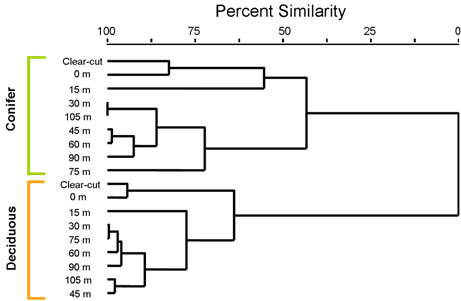
Figure 2: Cluster dedrogram from hierarchichal clustering analysis using the Bray-Curtis dissimilarity index. Text at the end of each branch represents the distance along the edge transect for each treatment.
|
|
| |
The NMS ordination shows a similar pattern within the community data, and explains a cumulative total of 80.4% of the variance in the data set (Figure 3). The stress is high at 19.24, and as Clarke (1993) suggests, the ordination picture has the potential to mislead the interpretation. Thus, the fine details of the ordination should not be emphasized, however the larger scale patterns are still reliable (Clarke, 1993). As is expected with this high stress, there is a large amount of variability within the ordination, however the clear-cut and zero meter treatments within both cover types homogenize and their variability is comparatively lower than the other treatments (Figure 3). In addition to this, the difference in community structure between the cover types at the clear-cut and zero meter treatments is high as is demonstrated by their distance apart in ordination space (Figure 3). |
|
| |
|

Figure 3: Non-metric multidimensional scaling ordination based on the Bray-Curtis dissimilarity index. Text labels represent the distance from the forest edge for the respective treatments.
|
|
| |
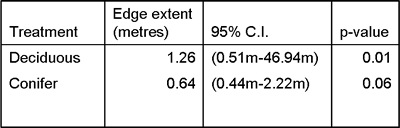
The NCAP analysis demonstrated a sharp transition in the ground beetle communities near the forest edge (Figure 4 and 5), but the results were not significant for the conifer cover type (Table 1). However, the analysis did predict that the extent of the edge effect was smaller in the conifer sites as compared to the deciduous sites (Table 1). The overall shape of the gradient function was consistent between the cover types with a higher degree of variability in the data points of the conifer cover type (Figure 5).
Table 1: Summary of results from NCAP analysis using logistic function. Edge Extent was predicted by model, with p-value calculated though monte-carlo analysis.
|
|
| |
|
.png)
Figure 4: Comparison of community composition (gradient index) to the distance along the edge transect within a 2 year old deciduous forest edge. |
|
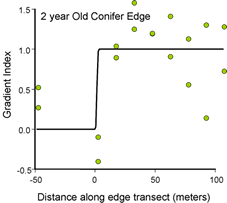
Figure 5: Comparison of community composition (gradient index) to the distance along the edge transect within a 2 year old coniferous forest edge. |
|
|
|
|
|
|
|
|
|
|
|
|
|
|
|
|