Developing Nano Biosensors
Despite considerable advances in protein (disease biomarker) detection, numerous current techniques (such as fluorometry, HPLC, reverse-phase ion-pair HPLC with electrochemical detection, coulometry, liquid chromatography, capillary electrophoresis, TLC, voltammetry, mass and fluorescent spectrometry) have limitations in distinguishing distinct conformations or closely lying molecular structures. Where enzyme linked immunosorbent assay (ELISA) based detection method provides more specificity, it has a detection limit and is expensive, time-consuming, plus substrate unreusable.
By combining the immunoassay and nanotechnology, a significant advance in protein detection could be achieved by increasing specificity, detection limit, speed, substrate reusability and decreasing cost.
We are
actively pursuing the detection of metabolic small-molecules and select protein
biomarkers using combinatorial nanotechnology and immunoassays. In particular, we have
developed following assays based on molecular recognition:
- simple fluorescence assay was developed based on gold surface for the detection of serotonin, an important neurotransmitter
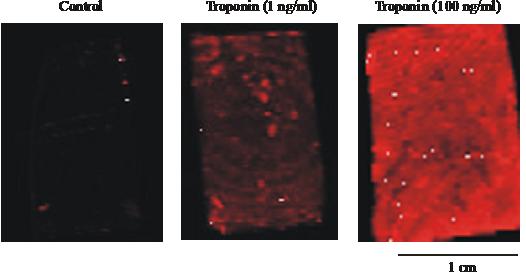
- a sensitive and selective detection of protein marker cardiac troponin I, early detection of which can reduce the risk of death from heart attacks in patients with a higher risk of acute myocardial infarction.
|