May - August 2005,
Department of Mathematical and Statistical Sciences, University of Alberta
|
|
|
Experiments/Research performed by Belal Sweileh, May - August 2005, Department of Mathematical and Statistical Sciences, University of Alberta |
Stratified fluid environments are those in which the effective density of the fluid continuously changes with height. Such stratifications are said to be stable if there is a continuous decrease in density with height; that is, lighter fluid is always located above heavier fluid. Stable stratifications naturally occur in the oceans and the atmosphere. If the density of a stratified fluid only changes by a very small fraction of itself over its depth, as in the oceans, such a stratification is Boussinesq. However, a stratification like that of the atmosphere which exhibits significant changes in the density of the fluid with height is non-Boussinesq (or anaelastic).
When a stable stratification is disturbed by a perturbation in the fluid, the forces of buoyancy and gravity tend to restore the fluid to the previous equilibrium state. For example, when a fluid parcel is displaced upward from its equilibrium position into a less dense region, the restoring force of gravity pulls it back down and displaces the parcel downward from its equilibrium position into a more dense region. The forces of buoyancy take over and push it upward, and the fluid parcel returns to the less dense region. This collective oscillatory behavior forms what is called an internal gravity wave.
Internal gravity waves can can propagate in both the horizontal and vertical directions transporting momentum and energy vertically and accelerating the flow of fluid at the levels where they break. Consequently, many studies have been conducted to understand the principles that govern the generation, interaction and decay of internal gravity waves. Some classical experiments were performed by Mowbray and Rarity in which an oscillating circular cylinder was used to generate internal gravity waves (Mowbraw and Rarity, 1967) . As predicted, they found that small-amplitude periodic oscillations generated a "St. Andrew's Cross" wave field. In those experiments, a standard schlieren technique was used to measure the spatial extent and phase of the waves, but the amplitudes of the waves could not be measured. Later on, a new "synthetic schlieren" technique was employed which non-intrusively measure the amplitude of internal gravity waves everywhere in space and time (Dalziel, Hughes, and Sutherland, 2000) . This new technique has been used to measure the amplitude of waves generated from a circular cylinder oscillating vertically and at an angle to the vertical (Sutherland et al (2000)) .
Small amplitude waves are generated by small cylinder oscillations, and the flow around the cylinder is approximately laminar. But what happens if the cylinder oscillations are large?
In our experiments, large-amplitude oscillations are employed to study the effect of turbulent boundary layers on the generation of waves as well as study the dynamics of waves in anelastic fluid. As a result of momentum conservation, upward propagating anelastic waves grow in amplitude whereas downward propagating waves decrease in amplitude.
|
|
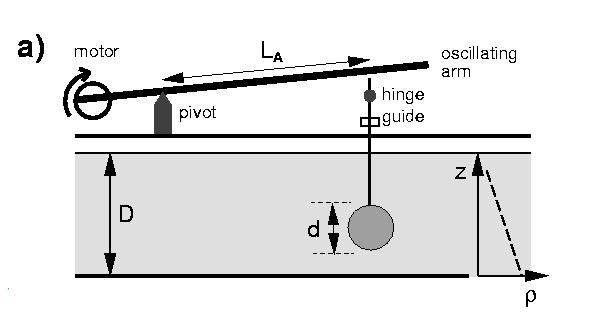
The experiments were performed in a long (about 122 cm) acrylic tank with width Lt=15.5 cm, and height D=53 cm. One of three long circular cylinders is suspended in the tank with its axis spanning the tank width. The diameters were d=4.20 cm, d=5.95 cm, and d=8.85 cm. Each cylinder is suspended from its center by a long thin metal rod, the other end of which was attached to an oscillator.
The tank was filled with an approximately exponentially stratified salt solution. Two salt solutions were used: saturated salt water (NaCl) and nearly saturated sodium iodide solution (NaI). The buoyancy frequency, N, was 1.94 rad/s in the case of NaCl, and 2.70 rad/s in the case of NaI, both set over 40 cm depth. Each cylinder was suspended with its center approximately 20 cm from either the top-right corner or the bottom-right corner of the tank.
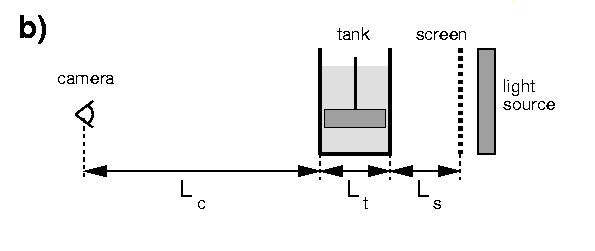
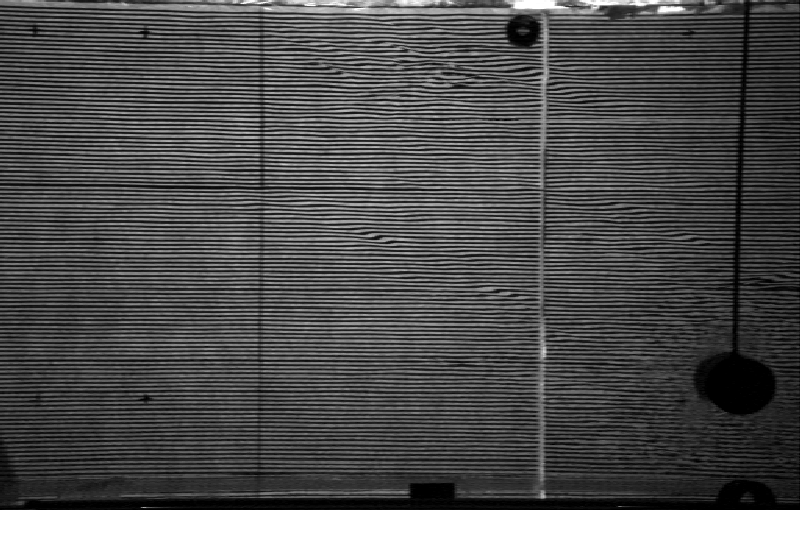
A synthetic schlieren system was used to visualize the internal waves. In the set-up employed here, a translucent screen of evenly spaced 2 mm thick horizontal black lines was positioned Ls = 15.5 cm behind the tank and was illuminated by fluorescent bulbs, as shown in Figure b). A CCD camera was positioned Lc = 465 cm from the front of the tank centered so that the circular cylinder was near the bottom right-hand side of the image and the screen of horizontal lines entirely fills the field of view. The signal from the camera was fed into a computer running the software package DIGIMAGE, which digitizes, enhances and manipulates the images.
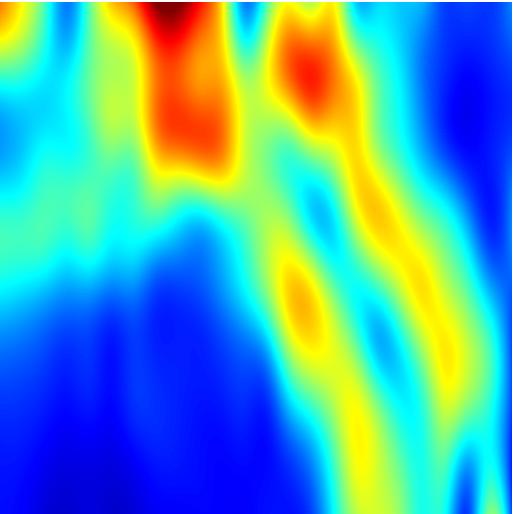
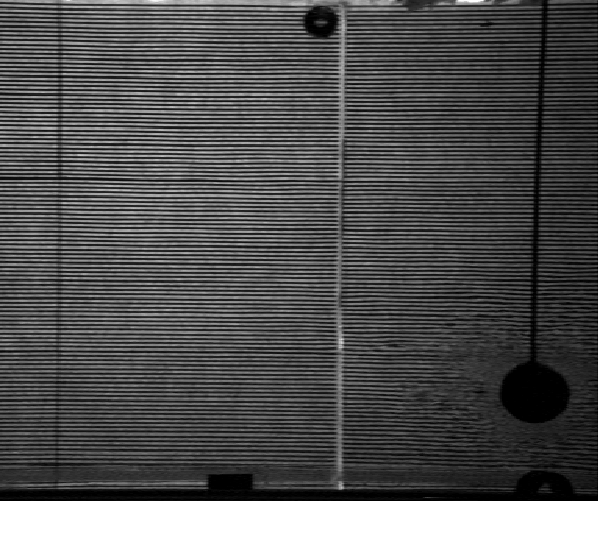
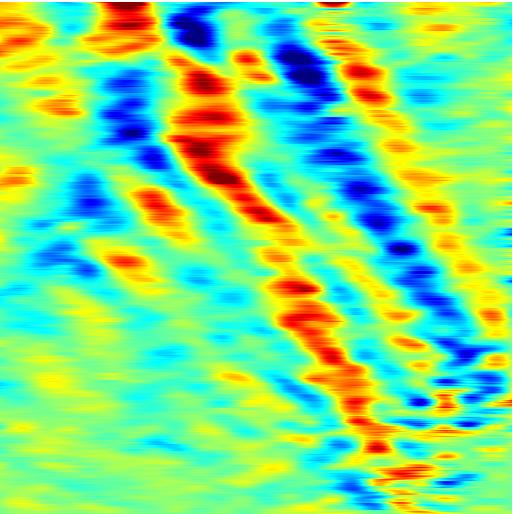
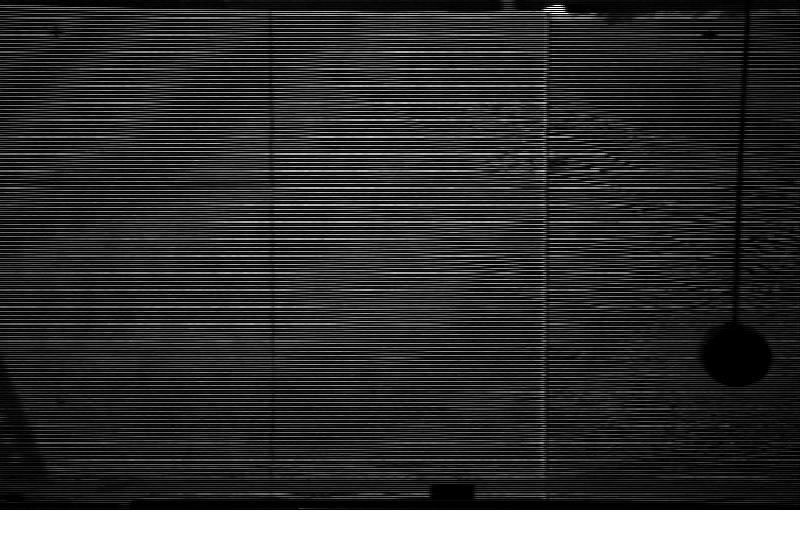
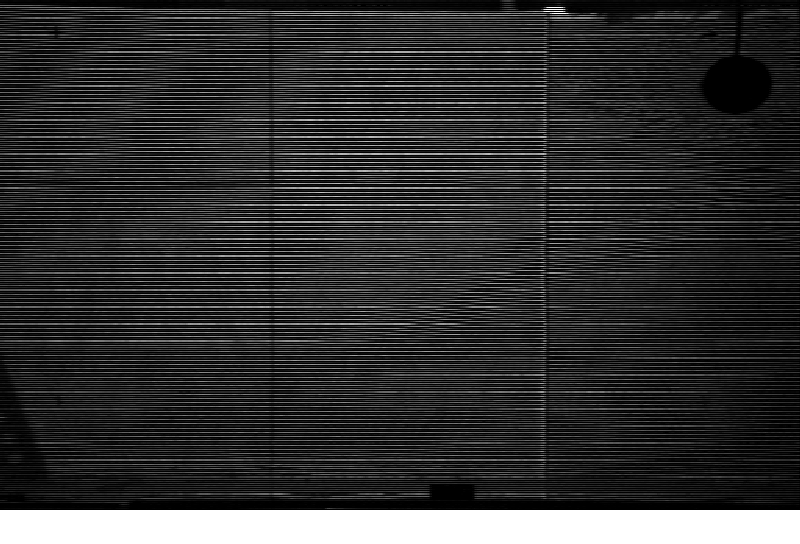
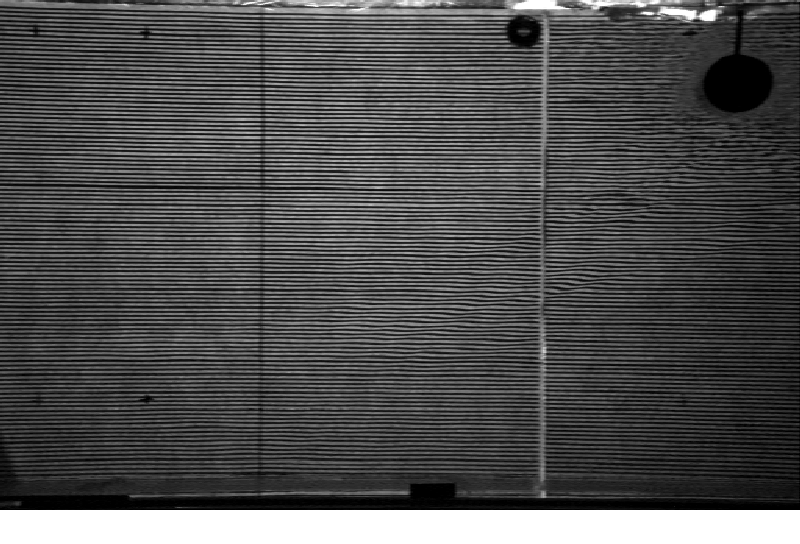
An example of the use of synthetic schlieren is shown in the images below. The unenhanced image taken by the CCD camera is shown in the image on the left. This shows a side veiw of the circular cylinder (of diameter 5.95 cm) with its center approximately 20 cm from the bottom-right corner of the tank. The vertical black line above the cylinder is the thin rod from which the cylinder is suspended. The image of lines behind the tank dominate the field of view. The image is taken during the course of an experiment in which the cylinder has been oscillating for many periods. As predited, internal waves eminate from the cylinder along four beams. Indeed, close to the cylinder, distortions in the background image can be seen with the naked eye. Computer enhancement helps visualize the distortions further from the cylinder and measurements of the N2t field can be made, as shown in the image in the middle. By performing a root-mean-squared and Gaussian averaging of the N2t field, its amplitude can be calculated as shown in the image on the right. (Note that the field of view for the calculated N2t and amplitude fields are not the same as that of the raw image on the left. The bottom-right corner of the N2t field is at the center of the cylinder. The field of view is 50 cm by 40 cm).
|
|
|
|
Raw experimental image of the cylinder taken after many oscillations |
N2t field. The red and blue regions represent the crests and troughs of the internal waves respectively |
Amplitude of N2t field. Red regions represent either crests or troughs |
To investigate the effect of anelastic conditions on wave breaking, four experiments were performed which compared the behaviour of waves travelling upward to those travelling downward. These experiments were performed in both NaCl and NaI stratifications. For each case, the experiment was performed with the cylinder 20 cm from the top-right corner as well as the bottom-right corner of the tank. The pictures below display spatial snapshots of the tank 70 seconds after the start of each experiment. For all cases, the ratio of the oscillation (or excitiation) frequency (omega) to the buoyancy frequency (N) is approximately 0.70. Moreover, the size of the cylinder and the amplitude of oscillation was kept constant. These snapshots show that waves travelling upwards (i.e. cylinder is at the bottom of the tank) exhibit more breaking than waves travelling downwards (i.e. cylinder is at the top of the tank).
| Cylinder near bottom: wave breaking | Cylinder near top: no wave breaking |
|
|
| Cylinder near bottom: wave breaking | Cylinder near top: no wave breaking |
|
|

|
To see how the internal waves are generated and how they propagate with time, click on the image to the left. Note how dark red regions after t=55 sec signifies wave breaking. This movie is taken from the experiment in which NaI was the solution and the cylinder is at the bottom-right corner of the tank. Note how the waves are propagating upward at an angle from the vertical. Also, notice how the dark red regions which appear after t=55 sec signify wave breaking. |
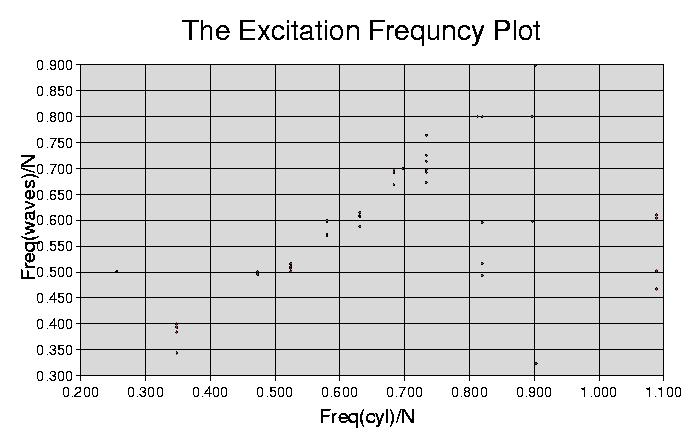
According to linear theory, internal waves eminate from the cylinder as four beams that form a "St. Andrew's Cross" pattern with the cylinder at the center of the cross. This pattern occurs only if the frequency of oscillation of the cylinder is less than the buoyancy frequency (that is, omega
The figure shows that linear theory is satisfied for values of omega/N<0.7 since the Freqcyl is equal to Freqwaves in this region. For larger values of omega/N, however, Freqwaves is less than Freqcyl and approaches a constant value of 0.5*Freqcyl as omega/N approaches unity.
|
S.B. Dalziel, G.O. Hughes and B.R. Sutherland, Expt. Fluids, 28, 322-325 (2000).
B.R Sutherland, S.B. Dalziel, G.O. Hughes, P.F. Linden, J. Fluid Mech., 390, 93-126 (2000).
D.E Mowbray and B. S. H. Rarity, J. Fluid Mech. 28, 1-16 (1967).
Department of Earth and Atmospheric Sciences