Evaluation of interpolated climate data was performed by comparing it with observed climate data. Interpolated climate data was generated for 224 weather station locations in western canada where climate data has been recorded for the 1901-2002 period.
Interpolated climate data was found to adequately estimate observed climate data at various weather station locations in western canada. Scatter plot of observed and interpolated climate data at all locations for for the 1961-1990 period are shown below.

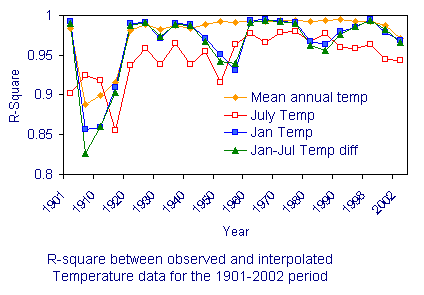
The r-squares for mean annual temperature, mean warmest month (July) temperature, mean coldest month (January) temperature and temperature difference are higher than 0.8 for the entire period. The values increase to approximately 1 with time, which could be explained by the increase in the number of weather station locations for observed climate. The number of weather stations that had records of climate between 1901 and 1920 are less than 20. However this number increased therafter to more than 90 observations that were used for temperature variables. The figure below was based on observed climate records at more than 99 weather station locations
|