

Methods
The study area includes
the City of Edmonton and rural agricultural portions of Strathcona
County (Figure 3). This approach maintains a level of consistency in
topographic features. Study sites were selected based on signs of
coyote presence and access permission.
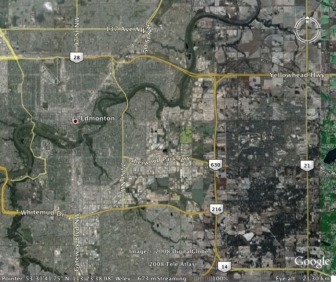
Figure 3. Aerial photograph of the City of Edmonton and Strathcona county, throughout which study sites were located.
A total of 15 remote trail camera sites
(Figure 4) were used during this study. Five sites were located in a
natural, protected area where coyotes were exposed to minimal human
activity. Five sites were located in rural areas, dominated largely by
agriculture. The remaining five sites were located in the Edmonton
river valley. When possible, cameras were situated near trails, roads
or forest edges, because the likelihood of capture is highest in these
areas1,2,3 (Figure 5). Cameras remained at a site for a minimum of 15 days, running 24 hours a day, as recommended by Moruzzi et al. (2002) and Larrucea et al. (2007).
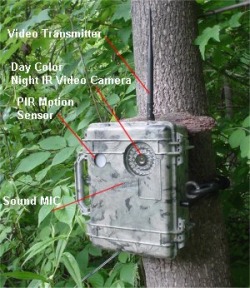
Figure 4. Remote trail camera used to capture images of coyotes and humans at each site.

Figure 5. An example of a typical area where a camera would be set up to capture images of coyotes and humans.
Daily activity patterns were assessed
primarily through date and time stamps on remote camera photos. A
relative activity index for coyotes was calculated from the number of
coyote images (Figure 6) taken at a camera site divided by the number
of nights the camera operated at the site4. This calculation was also used to determine the relative activity index for humans sharing the site.
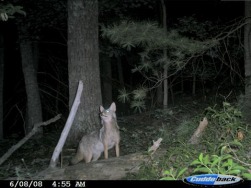
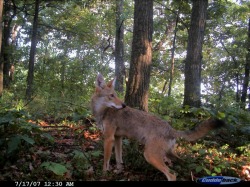
Figure 6. Examples of remote trail camera images from separate sites with date stamps in the bottom left corners.
Data Sets
Several
different data sets were required to complete the various
statistical and graphical analyses. Table 1 shows the
original data and its associated relative activity values. This data
set shows all 15 cameras across the three sites for 24 hours. This data
set was primarily used to assess the effect human activity levels had
on coyote activity levels, and as such, human relative activity level
was the predictor variable and coyote relative activity was the
response variable.
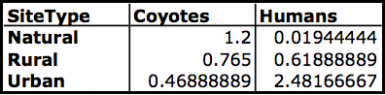
Analyses that focused more on differences
between site types typically required the use of mean values from a
site or for an hour of interest. Table 2 shows the average
relative activity levels of coyotes and humans in the three site types.
In this case, site type was predictor variable and coyote relative
activity was the response variable.
Table 1. Original data set with raw data from number of images per hour, per site. The above figure is
an example of data for one remote camera from one
urban site over a 24 hour period.
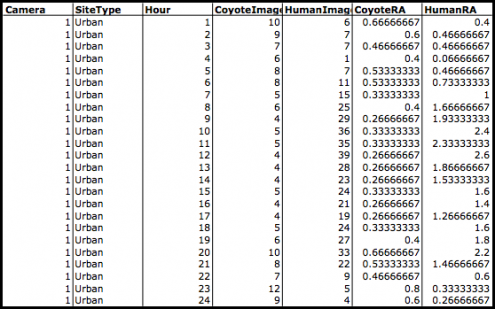
Table 2. Data set of mean relative activity levels for coyotes and humans in each site.
Literature
1 Gompper et al. 2006, Wildl. Soc. Bull. 34(4):1142-1151; 2 Larrucea et al. 2007, J. Wildl. Manage. 71(5):1682-1689; 3 Moruzzi et al. 2002, Wildl. Soc. Bull. 30(2):380-386; 4 Gompper 2002, BioScience 52(2):185-190;