

Statistical and Graphical Results

Figure 9. Effect of human relative activity on coyote relative activity in natural, rural and urban sites. The
red
line represents a logarithmic regression model curve
fitted to the overall data from all site types.
Table 3. Overall correlation between human relative activity and coyote relative activity across all site types.

Table 4. Correlation between human relative activity and coyote relative activity in each specific site type.
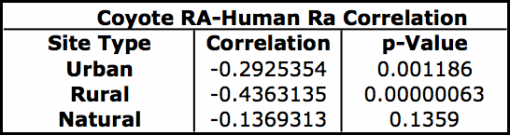
Figure 9 illustrates the relationship
between human relative activity and coyote relative activity. Across
all three sites, the overall trend in the data shows that an increase
in human relative activity is associated with a decrease in coyote
relative activity. Table 3 shows the overall correlation for all three
site types together. The correlation value of -0.455 indicates a
moderate negative relationship between human and coyote relative
activity, confirmed by the low p-value (2.20E-16). The red line
represents a logarithmic regression model curve. The logarithmic model
was the best fit for the overall data set, indicating that a drop in
coyote relative activity is not proportionate to the associated
increase in human relative activity.
Figure 9 also shows the
relationship between coyote and human relative activity at each site
type. The grey data points represent the natural site type and show
that human relative activity is consistently low or absent, while there
is a broad range of coyote relative activity. The gold data points
represent the rural site type and show that slight increases in human
relative activity are associated with large decreases in coyote
relative activity. The blue data points represent the urban site type
and also show that increases in human relative activity are associated
with decreases in coyote relative activity, though the decrease appears
to be less significant than in the rural site.
Table 4 shows
the correlation between human and coyote relative activity for each
site type. Both the rural and urban sites have low p-values and
correlation values indicating moderate negative correlations between
human and coyote relative activity (more so in the rural sites than in
the urban sites). The natural sites have a high p-value (0.1359) and a
correlation value of -0.137, indicating a very weak correlation between
coyote and human relative activity. This result was expected as human
activity was minimal at the natural site and coyotes were active
throughout 24-hour periods.

Figure 10. Average coyote and human relative activity levels across a 24 hour period in natural, rural and urban site types.
Table 5. Two-way ANOVA results from coyote relative activity data across all three site types divided into diurnal and nocturnal time periods.

Figure 10 shows the average coyote and
human relative activity over a 24-hour period in the natural, rural and
urban site types. As expected, coyotes in natural areas were active
throughout the diurnal and nocturnal periods, while human activity was
minimal or absent. In the rural and urban sites, coyote activity was
lowest and human activity was highest from approximately 6 AM through 6
PM. Human activity was lowest and coyote activity was highest from 7 PM
through 5 AM. The change in relative activity in urban coyotes over the
24-hour period appears more stable than the change seen in rural
coyotes. Diurnal coyote relative activity in rural sites drops quite
sharply from approximately 6 AM through 6 PM.
The data remained
organized by site type, but was further subset by defining 6 AM through
6 PM as diurnal and 7 PM through 5 AM as nocturnal. A two-way ANOVA was
then run to determine if any significant differences between diurnal
and nocturnal activity existed between the site types. There were
significant effects between site types and between times, but there was
also a significant interaction effect between site types and times
(Table 5). The high F-values and low p-values associated with the
variables and interaction indicate the significant effects. The
significant variable effects and interaction effect signaled a need to
examine nocturnal coyote relative activity and diurnal coyote relative
activity separately across the three site types using one-way ANOVAs,
performing pair wise comparisons to determine where the significant
differences were occurring.
Table 6.
One-way ANOVA with pair wise comparisons results from coyote relative
activity data for the diurnal period (6 AM through 6 PM) compared
between each site type.
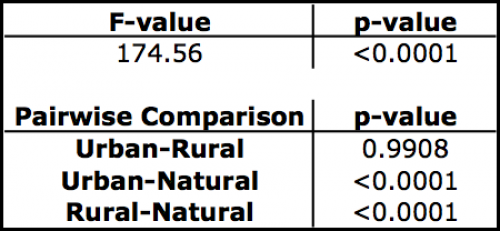
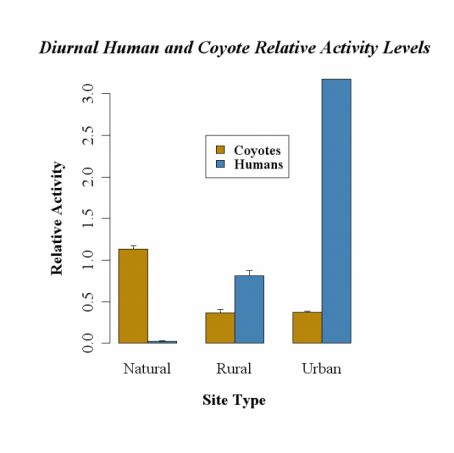
Figure 11. Average diurnal coyote and human relative activity in natural, rural, and urban site types.
Table 6 shows the results from the
one-way ANOVA with pair wise comparisons for diurnal coyote relative
activity across the three site types. The large F-value (174.56) and
small p-value (< 0.001) indicate that there is a significant
difference within the data. When urban diurnal coyote relative activity
and rural diurnal coyote relative activity were compared to natural
diurnal coyote relative activity, both comparisons showed a
statistically significant difference (p-values of < 0.001).
Surprisingly, when urban diurnal coyote relative activity was compared
to rural diurnal coyote relative activity, the p-value was 0.9908,
indicating that there was no difference in diurnal coyote activity
between the two sites. Figure 8 shows a graphical representation of
these findings, where the average coyote relative activity bars for the
rural and urban site types are virtually identical.
Table 7. One-way ANOVA with pair wise comparisons results from coyote relative activity data for the nocturnal period (7 PM through 5 AM ) compared between each site type.
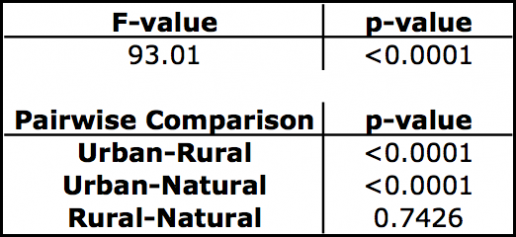
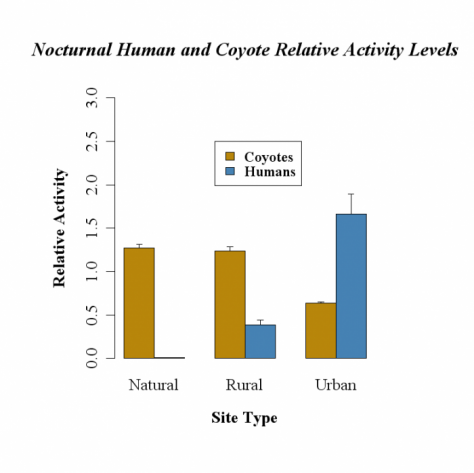
Figure 12. Average nocturnal coyote and human relative activity in natural, rural and urban site types.
Table 7 shows the results for the one-way
ANOVA with pair wise comparisons for nocturnal coyote relative activity
across the 3 site types. Again, a large F-value (93.01) and a small
p-value (< 0.001) indicate significant effects within the data.
Urban nocturnal coyote relative activity was found to be significantly
different from both rural and natural nocturnal coyote relative
activity. Interestingly, rural nocturnal coyote relative activity was
not significantly different from natural nocturnal relative activity.
Coyotes in rural areas likely behave similarly to their natural
counterparts during nocturnal periods as this is when human activity is
lowest. Exploitation related activities take place primarily during the
day, and as such rural coyotes have shifted their activity patterns to
avoid any contact with humans in the diurnal period.
The
urban coyote relative activity curve in figure 10 shows that coyote
relative activity remains more constant throughout a 24 hour period,
similar to natural coyotes but at a lower level. Urban coyote relative
activity may be similar to rural coyote relative activity during the
diurnal period, as management removes problem coyotes that are active
in the daytime and as such have a higher risk of conflict with humans.
Alternately, urban coyotes may be becoming habituated to human
activity. An urban area cannot support larger coyote populations and
this may explain the lower levels of activity. The consistency in
activity levels is indicative that coyotes do not significantly alter
their activity levels in response to increasing human activity levels
during the day.