

Statistical Assumptions/Tests
Figure 7 shows the distribution of coyote
relative activity data in the natural, rural and urban site types. Each
site shows a normal distribution of data with no skewing, and thus no
need for transformations. These distributions allowed me to proceed
with ANOVA tests.
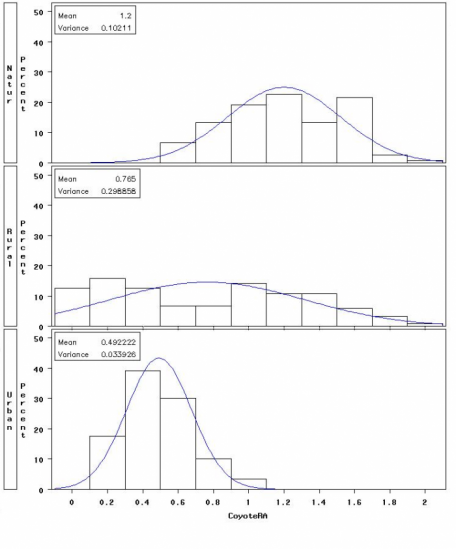
Figure 7. Distribution of coyote relative activity data in natural, rural and urban site types.
Figure 8 shows the residual plot of the
coyote relative activity data for the natural, rural and urban site
types. The plot shows that each site’s data has equal variance and
gives no indication of non-normal distributions, unequal variances or
outliers. Again, no transformations were required, and it was
acceptable to proceed with ANOVA.

Figure 8. Residual plot of coyote relative activity data in natural, rural and urban site types.
Limitations
The data from this study
does not take population density and seasonal variations in behaviour
into account. Both human and coyote population densities in an area
likely impact relative activity levels, and coyote activity patterns
(and like human activity patterns) also vary depending on the season.
As a result, this data currently only applies to the study sites during
the season the data was collected. The data can be applied to the
overall population when population densities and seasonal behaviour
variations have been incorporated.