Result of data cleaning
About 47,000 records of Alberta spring phenology data for 20 years (1987 to 2006) were merged and examined by natural subregion.
Mean dates for each species were graphed for the Central Parkland. Species appear in a consistent sequence each year. In an early year such as 1998 the whole sequence shifts to earlier Julian date values, and in late years such as 2002 the species sequence shifts to later values. This indicates high predictability in the data set, which should translate to valuable applications for decision making in sectors including forestry, agriculture and health.
More data checking will be done, but already it appears that these phenology data, gathered by the general public, are useful and adequately consistent.
Analysis with PCA
Principle components analysis (PCA) is one of a group of data reduction methods called ‘factor analysis’ (Dillon and Goldstein 1984). These methods look for structure in a group of variables, and reduce the variables to a small set of linear combinations that account for most of the variance in the data. PCA just defines the basic dimensions of the data and makes no assumptions about common factors.
The input data for the program PCORD 5.0 consisted of a table of mean first bloom dates, for 10 plant species, over 20 years (1987 to 2006) for the Central Parkland natural subregion of Alberta.
RESULTS
In
PCA, the first principle component accounts for the largest amount of
the total variation in the data. In this analysis, the first axis had
an eigenvalue of 19.8 and explained 98.9% of the variance. Thus all
species follow the same pattern. To tease out the small amount of
variation in the data, I graphed axis 2 versus 3:
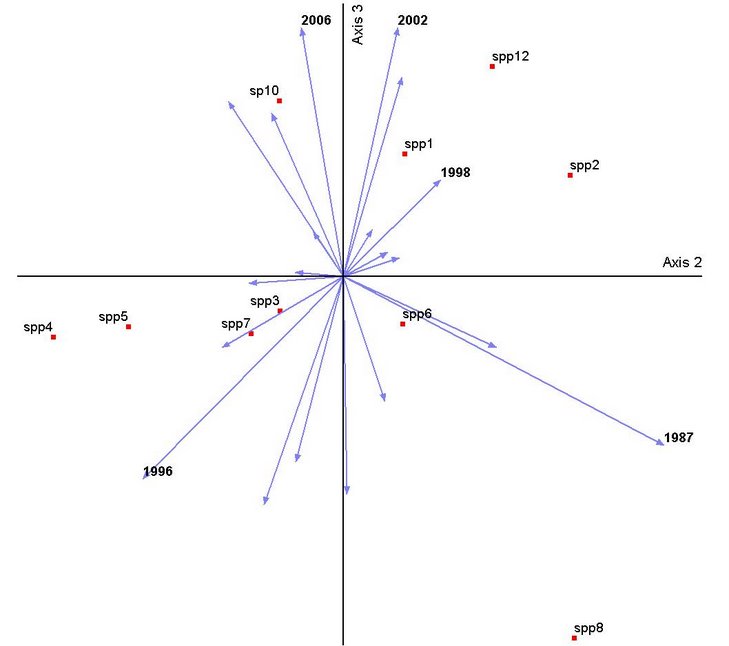
Similar blooming patterns are shown by species 3 (Viola adunca: Early blue violet), 7 (Prunus virginiana : Chokecherry), 6 (Smilacina stellata: Solomon’s seal), and 1 (Anemone patens: Prairie crocus). Species 12 (Achillea millefolium: Yarrow) and 2 (Populus tremuloides: Aspen poplar) are also similar to each other. Species 8 (Elaeagnus commutata: wolf willow) is very different from the others.
Short vectors show years that were similar. Long vectors show a different response from the others: note 1987, 1996, and 2002. 1996 and 2002 were years of late flowering.
Discussion
The fact that the first component explains 99% of the variation shows that there is high consistency between species in the spring flowering response between years. Species bloom in a predictable pattern each year, and if the first species blooms early, then so do all the following species.
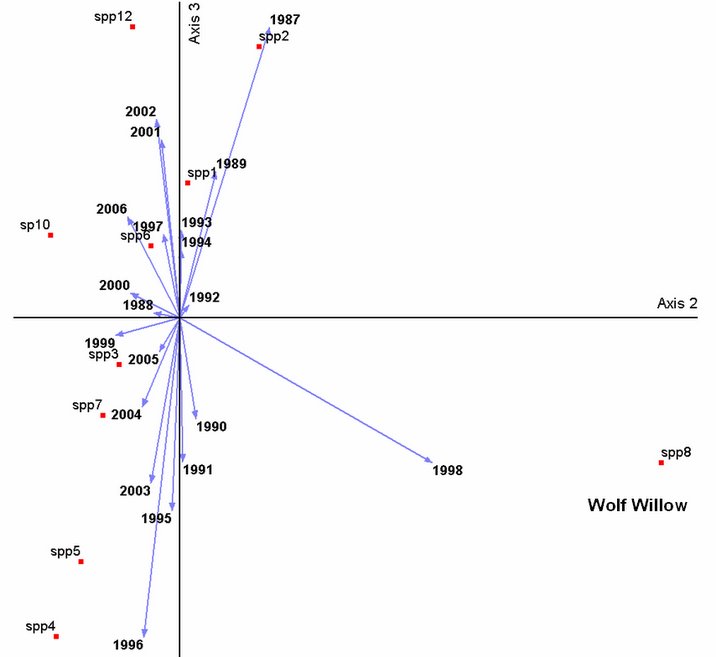
To test whether this analysis was properly reflecting that the data all shows a similar pattern, we did an experiment, to see if altering one data point would create a big change. The julian date for species 8 was changed for 1998 from day 143 to day 180. The result was dramatic; Now 1987 and 1998 have reversed position, and the location of species 8 show it is even more different from the other species.
Analysis using PRECON
OBJECTIVE: Which climate variable is the most important driver for spring bloom timing? Past research has shown that temperature has the greatest influence on spring timing, but in drought years are we seeing some influence from precipitation?
The program PRECON (from “preconditioning”) is an empirical model developed to analyse tree ring data. See http://www.ltrr.arizona.edu/~hal/precon.html
The procedure starts with a PCA on the input temperature or precipitation data and then adds a multiple regression of the biological response data (in our case bloom times) on the principal components of that data set. PRECON needs normalized data, so the julian dates were adjusted to have a midpoint of 1000. The input data for the Central Parkland natural subregion had mean bloom dates over 19 years (1987 to 2005) for each of 10 species. Data for 2006 was not included as the climate data was available only up to 2005. The months selected for analysis were from October of the year previous to bloom up to July after blooming. The latest bloom dates in the data set for the last species in bloom sequence were in July.
Results and Discussion: Temperature
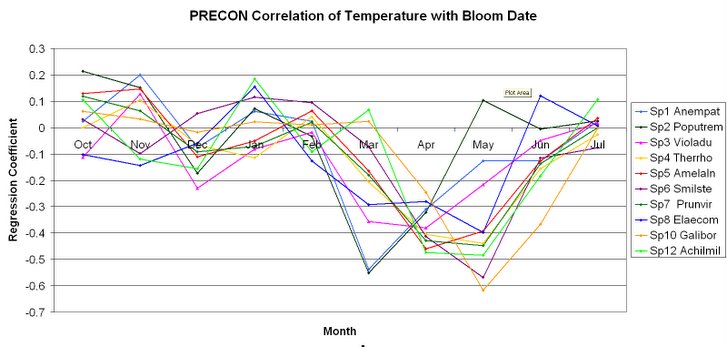

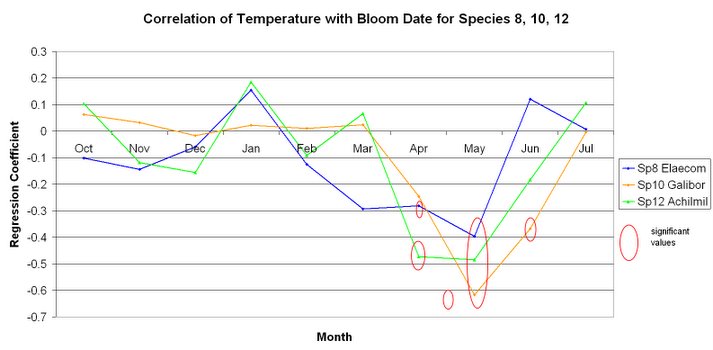
All species show significant correlations of first bloom timing with temperature in the one or two months before blooming. The first plant species to flower in our sequence ( species 1, 2, 3) also show a peak in November (though values are not significant). The positive correlation means that higher November temperatures are linked to later than usual spring bloom.
As the species bloom successively later in the spring sequence, the months showing temperatures significantly correlated with bloom times, advance as well. Though these values are not significant, most species show a similar pattern where lower temperatures in December correlate with later Julian dates (bloom times). Higher February temperatures have a weak correlation with earlier bloom times.
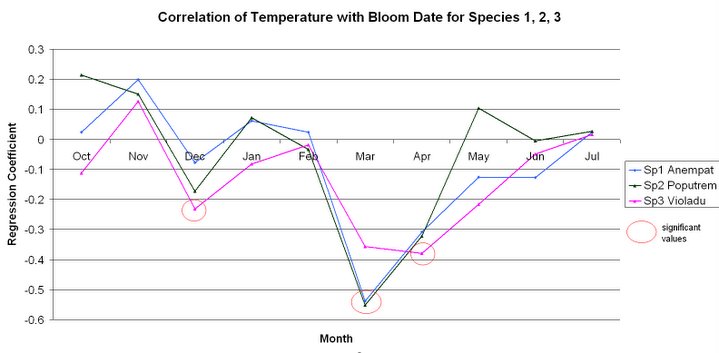
The earliest spp to bloom in spring, spp 1 - Anempat and 2- Poputrem, show very similar patterns before they bloom (generally in April) and have significant correlations between march temperatures and blooming times. The correlations differ after April. Poplar blooms very quickly in spring, after about 6 days of temperatures over 12º deg C (Moss 1960), whereas Anemone can continue flowering for a few weeks. Anemone’s bloom time is likely more influenced by ground conditions (winter depth of frost in soils, and spring snow depths).
Woody species (2- Poputre, 5- Amelaln, 7- Prunvir, 8- Elaecom) respond to temperatures at the height of their branches, as long as the soil is thawed.
Results and Discussion: Precipitation

While none of the values here (except species 8-Elaecom, in November) were significant, it is interesting that there is such a common pattern among species. For some species and locations I have more years of data which will be added for future analysis, to boost the significance level.
There is a peak of positive correlation in November, with higher precipitation in November correlating with later bloom the following spring. November precipitation in Central Parkland generally comes as snow. This may correlate with a longer thaw period in spring and later development of species. More precipitation in April is also correlated with later flowering (again this may be snow). Reduced precipitation in February and March are associated with earlier flowering, which may be because the reduced snow disappears earlier and general warming can then occur more quickly (reduced albedo, etc.).
Conclusion
This analysis confirms that temperature is an important climate driver for spring bloom timing and precipitation is not. Even in the drought year of 2002, when flowering for all species was late, moisture was not significantly correlated with bloom time.
Future Directions
a) Do plant species vary in the strength of their spring response to abiotic factors? Species which react most strongly to temperature may be the best “indicator plants’ for climate change studies.
b) Northern Alberta is warming faster than southern Alberta. A comparison of the last 15 years of temperatures with the climate normals for 1961 to 1990, showed the grasslands of southern Alberta warmed by 0.4 º C, whereas the north warmed by 3 times that value (M. Mbogga, pers.comm.) Are plants in the north also showing greater shifts to earlier spring development?
c) Do the phenology data for the urban centres of Edmonton and Calgary show the influence of the ‘heat island’, and how large is this effect compared to rural areas?
d) The early- blooming species in our sequence require less heat to bloom than later-appearing species (Beaubien and Johnson 1994). They are more susceptible to frost damage if their buds open in response to the higher temperatures in late winter and spring associated with climate warming. Is the ‘chilling effect’, a physiological response which protects tender buds from developing too fast in spring, becoming insufficient as temperature conditions shift?