BACKGROUND
All data for 1987 to 2004 had already been entered into either Paradox (Corel) or Excel (Microsoft). The data for 2005 and 2006 was entered in Excel 2003.
All past data sheets are kept in separate binders. To ensure a backup, photographs of all data sheets and field books (1987 to 2006) were done.
Data checking: Data for 1987 and 1988 had been partially cleaned already, and data for 1989 to 2000 was checked for accuracy of entry by 2 assistants in 2005. They paged through the annual binders of paper data sheets, checking the computer entry of every 5th observer and noted the number of errors.
Data preparation to merge data
a) All older files were converted from .dbf format (Paradox) to csv format for easy access and use in statistical packages.
b) The format for calendar dates and the numbers used for different species was found to be constant over the years.
c) Variable names were standardized.
d) For the purpose of this analysis, variables with information on the plant’s location (slope, aspect, proximity to obstacles, etc) were deleted from the active file
e) Files with bloom dates had calendar dates converted to Julian dates (day of the year, 1-365),

The date files were merged using SAS 9.1, and the resulting file had over 49,000 records.
f) Location files included location details for each observer . Observers usually report using “land legal descriptions” which uses section, township, range and meridian values. These were converted to decimal latitude / longitude values.

i) Some data was missing: the year 2001 had no locations entered. Using SAS, missing locations were filled in, using first data from the following year 2002 (as location details from observers likely improved over time), and if 2002 had no data, locations were used from the previous year 2000.
ii) The location files were merged using SAS. The result was a file with 4700 locations.
g) The merged files were checked and duplicate entries deleted. The location file was reduced to 4452 unique locations, and the date file had 47,138 records (1987 to 2006). Date and location files were merged.
Adding Ecosystem information
a) Using Arcview GIS 3.3, the Alberta natural subregions layer was used to group observations.

b) Four extra divisions were created to subdivide larger regions and to separate
cities which are affected by the 'urban heat island effect'. For a key to the regions
below see the Alberta natural subregions map.
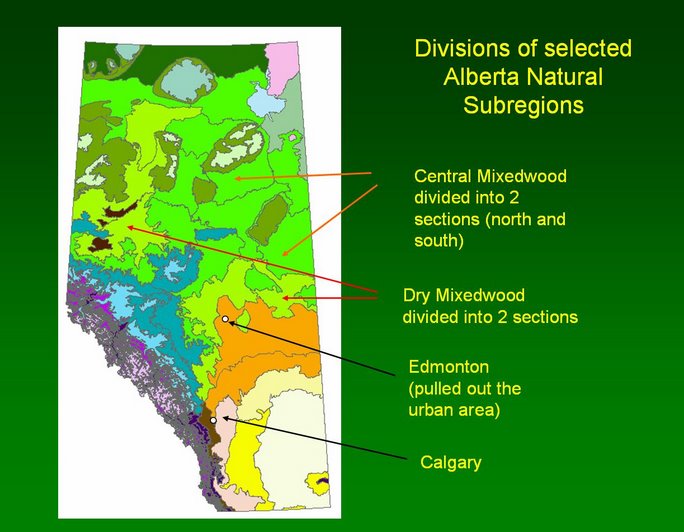
Using satellite coverage (MODIS), polygons were made around observation location points in the largest two urban centres of Calgary and Edmonton, and these two areas were separated for future analysis.
Goal achieved!
The final product was a flat file with all data with the following variables: Latitude, Longitude, Elevation, Observer number (“PREG” for personal registration number), Location number (LC), Species number (SP), growth stage or phase (PH), date (calendar date), Julian (year date) and then ecosystem zones from the Alberta coverage (NSR, VARIANT, PHASE) and finally our system of ecosystem divisions (ECOSYS).