Pivot tables in Excel 2003 were used to calculate the mean first bloom Julian date for each year and ecosystem for all 25 plant species that have been observed over the 20 years. The growth stage called phase 1 or first bloom was selected as generally providing the best data for most of the plant species.
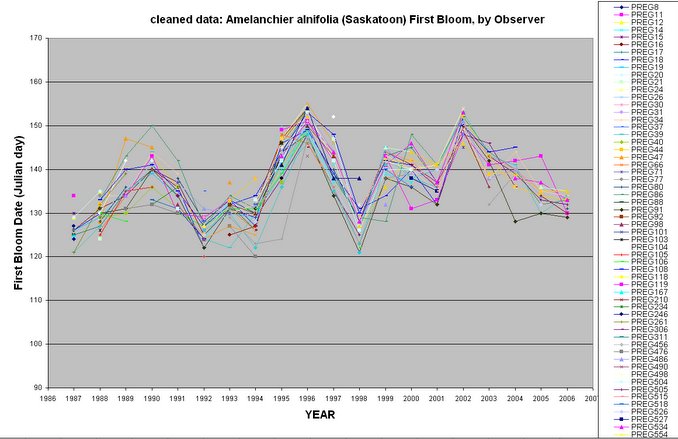
The species with the most data and what appears (on the graphs) to be the most consistent data, is species 5: Amelanchier alnifolia Saskatoon). 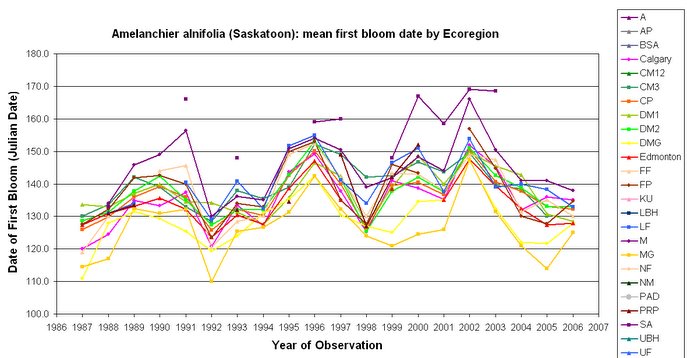
Click here to see the map of Alberta natural subregions (and a key to the ecoregions).
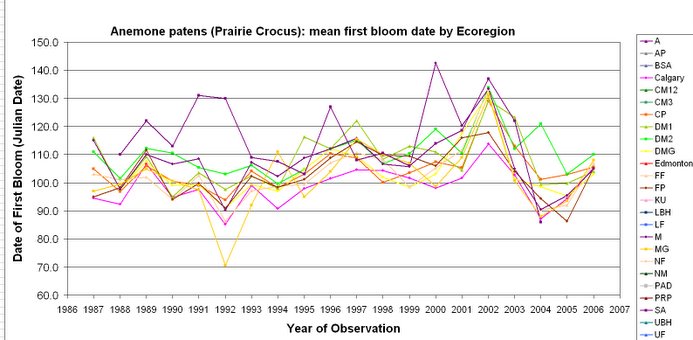
For comparison and contrast, this graph of Anemone patens (Prairie crocus), shows more intra- annual variability than Saskatoon.
The largest data set, Central Parkland, was selected for futher analysis.
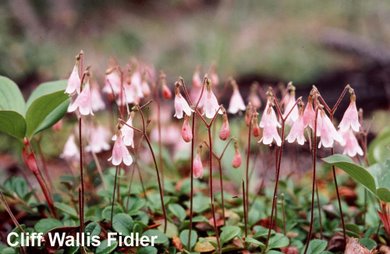
The following subset of plant species had the most data (15 -20 yrs) and was used for further analysis. See photos of species 1-8, and species 10,12.
|
Species # |
Latin |
Common name |
|
1 |
Anemone patens |
Prairie crocus |
|
2 |
Populus tremuloides |
Aspen poplar |
|
3 |
Viola adunca |
Early blue violet |
|
4 |
Thermopsis rhombifolia |
Golden bean |
|
5 |
Amelanchier alnifolia |
Saskatoon |
|
6 |
Smilacina stellata |
Star-flowered Solomon's seal |
|
7 |
Prunus virginiana |
Chokecherry |
|
8 |
Elaeagnus commutata |
Wolf willow |
|
10 |
Galium boreale |
Northern bedstraw |
|
12 |
Achillea millefolium |
Yarrow |
Using Excel 2003, pivot tables and graphs were created to track each species’ data
by observer over the years, to show sources of erratic data. Points which were either extremely late or early, or showed trends which were counter to the inter-annual trends in other data, were investigated on the original data sheets. Three observers were found to have erratic data for many species, and their data was deleted. The total number of records was reduced by 1018 to 46,006. Pivots and graphs were redone. (In future this deleted data will likely be added back in and better cleaning methods used, so that any consistent data is not lost.)
Amelanchier data before cleanup:

(Preg means personal registration number assigned to each observer)Amelanchier data after cleanup: