TCI QuickTake: Canada’s Goods Exposure to China May Be Significantly Larger Than its Export Data Suggest
Dr. Weisu Yu & Philippe Rheault - 2 June 2026
Chinese import-side mirror data, which capture how China records imports from Canada, point to a larger Canadian-origin goods footprint — and a more complex bilateral trade relationship than headline export figures imply.
In fact, the Canada–China goods relationship looks quite different when viewed through Chinese import-side mirror data. As leaders from both sides continue to look towards a deepened commercial relationship, the following offers additional useful context:
In 2025, China reported USD 41.5 billion[1] in imports from Canada, while Canada reported USD 24.4 billion in exports to China. The USD 17.1 billion gap[2] should not be read as a revision to Canada’s official trade deficit or balance-of-payments accounts, which are measured on a balance-of-payments basis. But it does suggest that Chinese import-side data capture a larger value of Canadian-origin goods entering China than Canada’s export-side product data record as exports to China.
That distinction matters. Trade balances and export totals shape how governments, businesses, and the public understand the relationship. If the value of Canadian-origin goods entering China is larger than Canada-side export data suggest, then Canada’s commercial relationship with China may also be more complex than the headline figures alone imply.
It also matters in light of Canada’s stated trade-diversification objectives. Prime Minister Mark Carney’s January 16 announcement referred to Canada’s “ambitious goal to increase exports to China by 50% by 2030.” Separately, Global Affairs Canada’s 2026–27 Departmental Plan states that GAC will implement the Trade Diversification Strategy to “double Canada’s non-U.S. exports within the next decade through forging new beneficial economic partnerships.” Mirror data do not change the official statistical basis for either objective, but they do suggest that the China-facing goods relationship may already be significantly larger than Canada-side export figures indicate. More importantly, they help distinguish between trade with China and exposure to Chinese demand — a distinction that is especially important for globally traded commodities.
[1] Source: Data are from ITC Trade Map, based on product-level bilateral trade statistics for 2025. China-side figures refer to China’s reported imports from Canada, while Canada-side figures refer to Canada’s reported exports to China.
[2] Even mirror data may not fully capture the complete picture. Some Canadian-origin goods may move through intermediary markets, re-export channels, or informal trade routes before reaching their final destination. As a result, the full scale of Canada-China goods linkages may be larger or more complex than either country’s official bilateral statistics suggest.

Source: ITC Trade Map
Explaining the discrepancy
Trade balances are often treated as simple facts, but they are built from reporting systems that do not always see the same shipment in the same way. This is why mirror gaps can emerge: goods may move through intermediaries, be valued at different points in the transaction, or be recorded under different reporting conventions.
For example, a good may leave Canada for an intermediary market before being shipped onward to China. Canada may record the first destination as the export market, while China may record this good as an import from Canada because Canada is the country of origin. Valuation differences can also contribute to discrepancies: China’s imports are valued on a CIF (cost, insurance, and freight) basis, while Canada’s exports are reported on an FOB (free on board) basis, excluding those additional costs. As a result, the two countries may record the same underlying flow of goods differently in terms of value or destination.
Mirror data do not prove that one country’s statistics are “right” and the other’s are “wrong.” They reveal how different reporting conventions capture different dimensions of the same commercial reality.
In this case, the difference is too large to treat as a statistical footnote: China’s reported imports from Canada were roughly 70 percent higher than Canada’s reported exports to China in 2025.
That is large enough to affect how Canada’s trade relationship with China is interpreted. If Chinese import data capture Canadian-origin goods that are not fully reflected in Canada’s export data, then Canada’s commercial exposure to Chinese demand may be larger than the Canadian numbers alone suggest.
The implication is practical: using both Canada-reported export data and China-reported import data gives policymakers and businesses a clearer view of the goods relationship. The two series are not interchangeable and cannot be merged into a single “correct” number. The mirror-data comparison also remains separate from Canada’s official balance-of-payments trade balance. But showing both views side by side can help identify where Canadian-origin goods are entering the Chinese market, which sectors may be understated in Canada-side destination reporting, and where exposure to China may be larger than headline export figures suggest.
Gold and to a lesser extent crude oil drive much of the discrepancy
Meanwhile, our analysis shows that the mirror gap is not spread evenly across all products. It is highly concentrated.
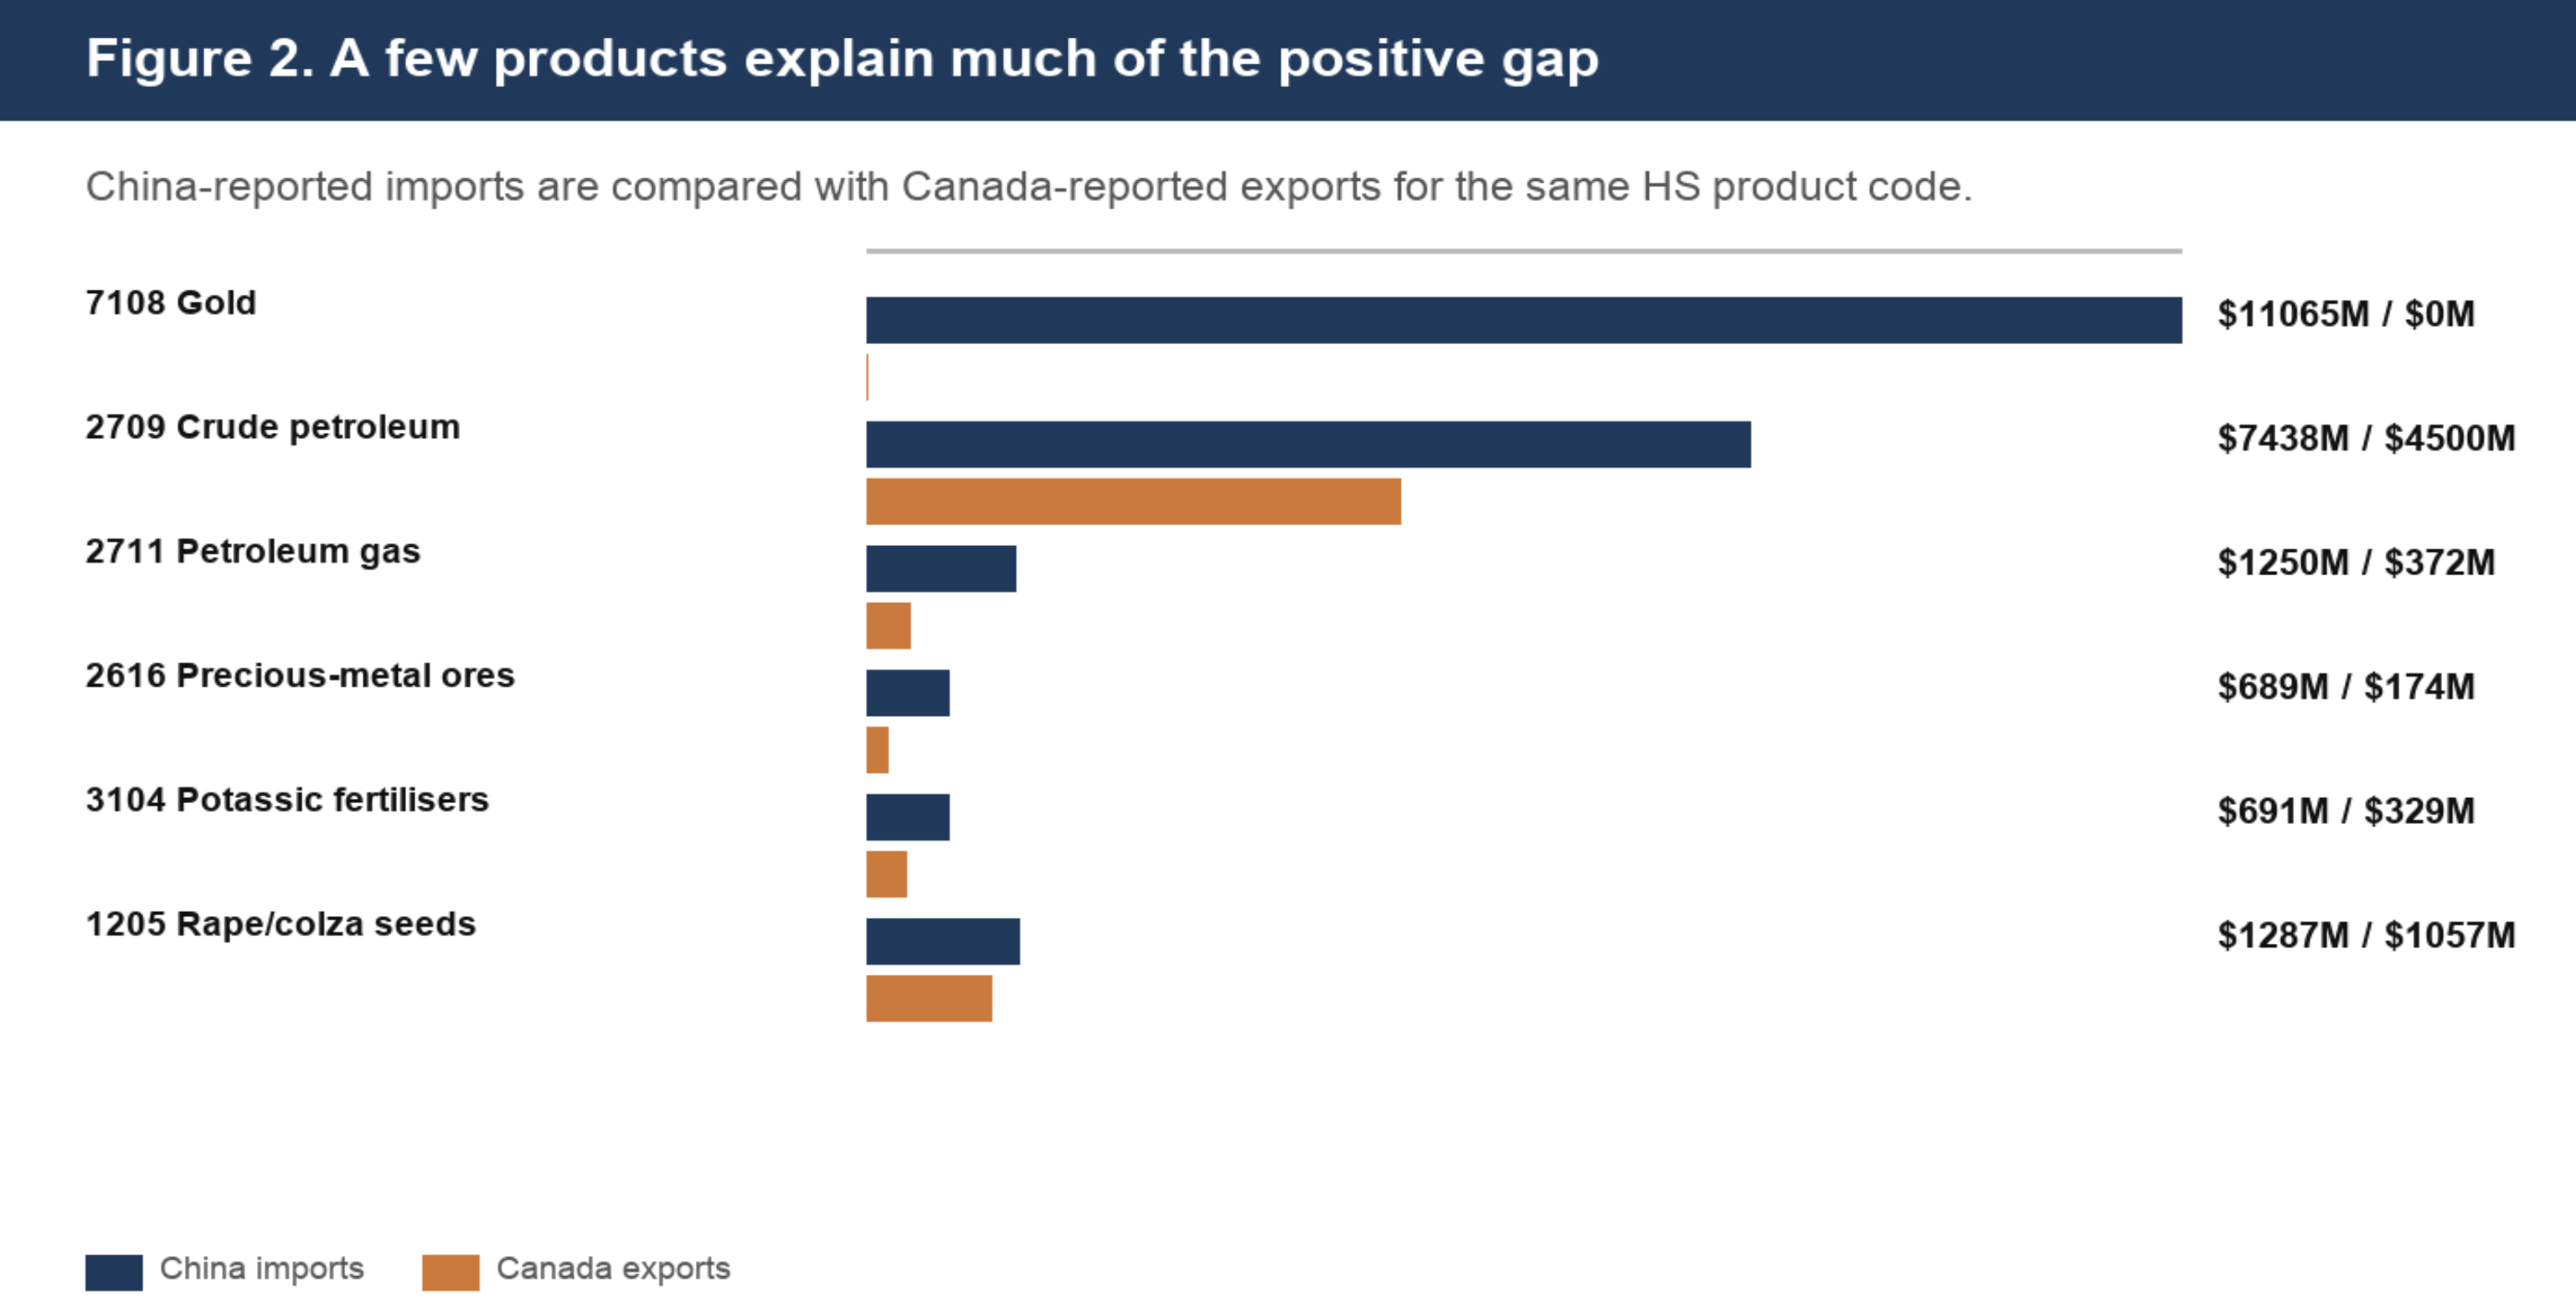
Gold is the most striking example. In 2025, China reported USD 11.065 billion in imports of HS 7108 gold from Canada. Canada reported only about USD 0.1 million in exports to China in the same product category.
That single product accounts for roughly USD 11.1 billion of the overall gap. In other words, gold alone explains about 65 percent of the total reporting difference.
Other resource products also contribute to the difference. China reports higher imports than Canada reports exports in categories such as crude petroleum, petroleum gas, precious-metal ores, potassic fertilisers, and canola or rapeseed.
The product concentration makes the mirror gap more useful as a policy signal. Rather than treating the discrepancy as a broad statistical problem, Canada can focus on a small number of high-value sectors where reporting gaps are largest. For sectors already exposed to policy risk, such as canola, better product-level visibility can help distinguish between reporting differences and actual changes in market access, demand, or exposure.
Source: ITC Trade Map
What this means for Canada
Mirror data are a diagnostic tool, not a correction. They should not be treated as a substitute for Canada’s official balance-of-payments trade balance. But they do show that the goods relationship looks different when measured from the Chinese import side — and that difference is worth taking seriously.
The most important implication is not statistical. It is that Canada’s commercial relationship with China may be larger and more structurally embedded than bilateral export data suggest. For Canada’s highest-value export categories — gold, petroleum, fertilisers, precious-metal ores — a significant share of Canadian-origin goods appears to reach China through global commodity markets and intermediary trading hubs rather than through direct bilateral flows. Canada’s export data, which record the declared destination of shipments, do not fully capture where Canadian-origin goods ultimately end up or whose demand is driving their production.
This distinction between trade with China and exposure to China matters for policy. Canada’s bilateral export figures track what Canada reports shipping to China. They do not fully capture Canada’s exposure to Chinese demand, which is also transmitted through global commodity prices that China, as a dominant buyer, substantially influences. For globally priced commodities, Canadian producers can be deeply exposed to Chinese demand cycles even when the bilateral trade numbers suggest otherwise.
The distinction also matters when assessing Canada’s China-specific export-growth target. Based on Canada-side data, exports of C$33.48 billion in 2025 would need to reach roughly C$50.22 billion to meet a 50 percent increase benchmark. China-side import data, by contrast, suggest a much higher Canadian-origin goods figure of about C$58.06 billion. This does not mean the target has been officially met under Canada’s own statistical framework. But under a China-side mirror-data lens, the implied 50 percent benchmark would already be exceeded by roughly C$7.84 billion.
The mirror-data gap is less useful for assessing Canada’s broader goal of doubling non-U.S. exports, since many of the goods China records as Canadian-origin imports may already be captured in Canada’s exports to other non-U.S. destinations. For that broader objective, mirror data do not necessarily imply additional export volume. Their value is different: they help clarify where Canadian-origin goods ultimately end up, and therefore where Canada’s exposure to final demand may be greater than destination-based export data suggest.
The largest mirror gaps should be investigated product by product. Gold is the obvious starting point, followed by crude petroleum, petroleum gas, fertilisers, and precious-metal ores. The goal should not be to force one final number, but to better understand the reporting, routing, valuation, and ownership conventions behind the difference. That understanding would give Canada a clearer picture of where its commercial exposure is actually concentrated — and where diversification efforts would need to go deepest to meaningfully reduce it.
A better approach going forward would be to treat numerical export targets as only a starting point. The more important task is to identify which sectors should be prioritised, where Canadian exposure to Chinese demand is already significant, and how trade growth fits within a broader, more articulated China engagement strategy.
Authors

Dr. Weisu Yu
Postdoctoral Scholar
Weisu holds a Ph.D. in Finance from the University of Alberta, and her academic interests lie in Corporate Finance and Sustainable Finance. Her current research focuses on Canada–China trade relations, the electric vehicle industries in Canada and China, and Chinese investment in Canada.

Philippe Rheault
Director
Philippe Rheault is the Director of The China Institute at the University of Alberta, following a 25-year career in the Canadian foreign service with a primary focus on China and East Asia.