


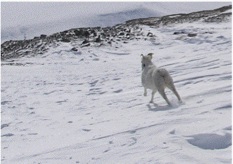
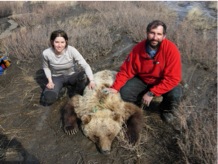
Capture and GPS tracking of Dall’s sheep, grizzly bears and
wolves
Our
first capture session occurred in April 2006 for Dall’s
sheep and wolves, and in May 2006 for grizzly bears. We
fitted six Dall’s sheep ewes, seven grizzly bears (5
females and 2 males) and eight wolves from two different
packs with GPS radio-collars (Telonics TWS 3680 for grizzly
bears; TWS 3580 for ewes and wolves; and also Lotek 3300SW
for wolves). Captures were conducted by highly trained
professionals, in accordance with guidelines approved by
the Canadian Association of Zoo and Wildlife Veterinarians
and the Government of the Northwest Territories. The
collars were programmed to record 6 locations a day during
most of the year, and 12 locations a day from May 15 to
June 14, which assure higher monitoring intensity during
lambing season. Grizzly bear collars enter a standby mode
from November 30 to April 1 –during hibernation. All
collars are equipped with an automatic release mechanism to
facilitate the collar recovery after the end of the battery
life and to minimize disturbances to the animals. For all
of the marked animals except the six wolves wearing
store-on-board collars (Lotek 3300SW), partial locations
are transmitted every week, and we have so far collected
over 2,500 locations, which are used for this analysis. The
remaining locations will be obtained when we will retrieve
the collars from the field, after the end of the battery
life.

Habitat
monitoring
Landscape
features of the Richardson Mountains were characterized
using data from the Gwich’in GIS Project (Source: GRRB and
Gwich'in Tribal Council). Layers included in the resource
selection analysis include topographic coverage,
vegetation, rivers and streams. Digital elevation maps
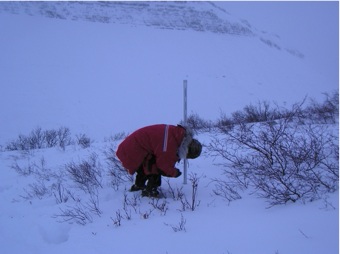
(Can30dem) were also used. In the future, a snow map of the
study area will also be included in the analysis, as we
will start monitoring snow depth and density in the study
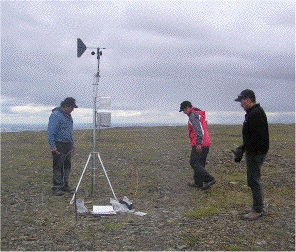
area in early 2007. Moreover, climate data will also be
incorporated to this analysis in the future, as a weather
station was erected last August and was programmed to
record temperatures, wind speed, humidity and atmospheric
pressure.
Analytical methods
Although
some of these methods may change in the future, one of the
goals of this exercise was to explore the various possible
techniques and decide which ones might be useful in the
future. Here I briefly outline the methods used and justify
my choice.
As conducted by Doncaster (1990) and Gehrt and Fritzell
(1998), I investigated the interactions between Dall’s
sheep, grizzly bears and wolves at both the static and
dynamic levels. Static interactions can be estimated mostly
by home ranges and overlap between individual. Dynamic home
ranges were evaluated by examining the locations of
collared animals at simultaneous times. More specifically,
I calculated the average as well as the minimum distance
between pairs of individuals for all time intervals when
there were two or more individuals monitored
simultaneously. To ensure precision but allow for some
transmission error, locations were grouped at the nearest
seven minutes time. Proximity matrices were calculated
based on the average and minimum Euclidian distance values,
and the proximity between individuals was estimated with a
metric
Multidimensional Scaling analysis
(MDS). This multivariate technique is particularly useful
to visualize the data and interactions between individuals.
To estimate impact of various habitat features on the
interactions and habitat use of Dall’s sheep, grizzly bears
and wolves, I conducted various GIS analysis, joined layers
and extracted data, in order to organize my data such as
each animal location, along with a set of random locations,
would be characterized with an elevation, a slope, an
aspect, and the presence of vegetation or not. My initial
intention was to perform a resource selection function
(Boyce and MacDonald, 1999), as most multivariate
techniques are not usually used for habitat selection
studies (Manly et al. 2002). Nevertheless, as I had many
variables and many observations, I decided to try a
Principal Component Analysis, to
reduce the number of variables that need to be considered
to a small number of indices (the components) and see which
variables should be retained in a resource selection
function analysis (Manly 1986). Finally, I also performed
a
Canonical Correspondence Analysis (CCA),
which has been developed to allow ecologists to relate the
abundance of species to environmental variables (Ter Braak
1986). It can provide an assessment of the relative
importance of each habitat variable to the presence of each
species. The relationships were completed using a
Spearmans's Rank correlation analysis. This univariate
non-parametric statistical technique enables the
relationship between species occurence and abiotic factors
to be analyzed individually.