FIGUREs 10 & 11 are the outputs for the princomp PCA analysis. Red, blue and green indicate known early, mid and late successional species respectively. Uncolored values represent species whose successional classification is unknown. FIGURE 10 shows that the early successional species group together based on the clustering values in both the Young Growth stand (PLOTA) and the Old Growth stand (PLOTC) and the slope of the dbh distribution in the Young Growth stand (PLOTA). Species 30 (TABUYOG (Ficus congesta Roxb.) from the Moraceae family) is the only exception to the grouping. Tabuyog has almost a 50% higher frequency then the species with the second highest frequency in the Young Growth stand (PLOTA). This drastic difference can possibly explain the grouping discrepancy. FIGURE 11 shows the same PCA analysis as in FIGURE 10, but values are plotted based on the clustering values in the Young Growth stand (PLOTA) and the slope of the dbh distribution in the Old Growth stand (PLOTC). By changing the values that are plotted in the PCA biplot the direction of the frequency and slope of the dbh distribution in the Young Growth stand vectors overlay one another and as a result pulls Tabuyog into the early successional grouping. The PCA scores can be viewed in the PCA Data Table.
The CLUSTER analysis gave a similar result as the PCA analysis. FIGURE 12 is the resulting dendrogram showing the
distances between the species based on the given variables. The same colour legend was applied to the dendrogram as
the PCA analysis. As in the PCA, there is a clear separation between the known early succession species and the mid and
late successional species, but the separation between the known mid and late successional species is less defined.
Based on the result of the PCA and CLUSTER analysis further multivariate analyses can be done to predict the succession
classification for the unknown species and to determine which variable have the greatest impact on the classification.
The DISCRIM Appendix link shows the F-statistics for the squared distances among the group centroids for each
successional classifications. The resulting degree
of freedom in the numerator is NDF=4 and the degrees of freedom in the denominator is DDF=8. Based on the degrees of
freedom and the adjusted T^2-value the critical F-value for the F-test is approximately 0.17. Test values from the PROC
DISCRIM analysis were all larger then the critical F-value and the null hypothesis can be rejected in each case.
This result is encouraging since it shows that
there is a definite separation amongst the early, mid and late successional species based on the variables that were
analyzed.
PROC DISCRIM automatically classified the succession classifications while calculating the F-statistics. Based on
the known 5 early, 4 mid and 5 late successional species a model was generated to classify the remaining 21 unknown
species.
The succession classification with the highest probability determined the species classification. The results of the
predicted classifications were 13 early, 14 mid and 8 late successional species. Incorrect classification probabilities
from PROC DISCRIM were calculated as follows:
Select the link to view the
Predicted DataTable
which shows the predicted succession classification and the predictor percentages for each classification.
PROC CANDISK rotates the values of the variable until a clear distinction between the successional classifications is
made.
FIGURE 13
is the resulting graph that illustrates the grouping of each of the successional classifications.
The STEPDISK function used F-values based on an analysis of covariances to establish which variables have the greatest
significance in determining the succession classification for species. The stepwise selection procedure suggested that
the frequency in the Old Growth stand (PLOTC) and the slope of the dbh distribution in the Young Growth stand (PLOTA)
contribute significantly in classifying
whether a species is an early, mid or late successional species. The frequency in the Young Growth stand (PLOTA) and the
Mid Growth stand (PLOTB), clustering in all stand, and the slope of the dbh distribution in the Mid Growth stand (PLOTB) and
the Old Growth stand (PLOTC) should therefore be dropped in future analysis. This suggests that further tests need to
be done on frequency, clustering, and the dbh distribution within the stands to verify this result, since known traits of early,
mid and late successional species are not suggested as significant.
HOME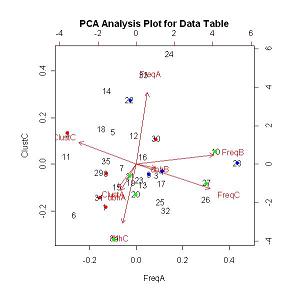 FIGURE 10
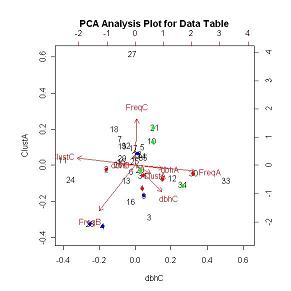 FIGURE 11
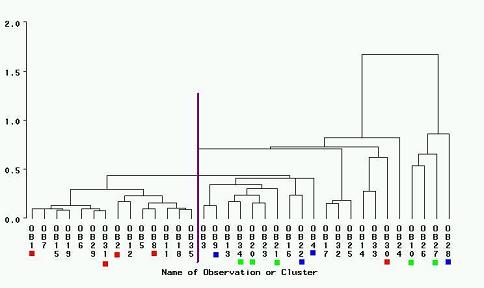 FIGURE 12
PCA Appendix (Appendix B)
CLUSTER Appendix (Appendix C)
Multivariate Results & Discussion:
Test the Difference Amongst Group Means
Multivariate Results & Discussion:
Prediction of the Succession Classification for Unknown Species
Classification Early> Mid Late Overall
Error Probability 0.0 0.25 0.2 0.15
The probability for incorrectly classifying a mid or late succesional species as an early successional species is high, but
can be explained by the low frequency of test points. While only 1 mid and 1 late successional species was incorrectly
classified, only 4 mid and 5 late successional species were known, therefore even incorrectly classifying 1 species results
in large error probabilities. To obtain more realistic error probabilities more known species would have to be tested using
this discriminate analysis classification.
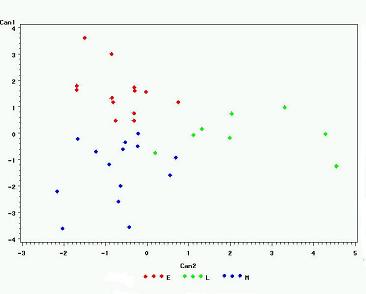 FIGURE 13
DISCRIM Appendix (Appendix D)
CANDISK Appendix (Appendix E)
INTRODUCTION
DATA DETAILS
MULTIVARIATE METHODS
MULTIVARIATE RESULTS & DISCUSSION
CONCLUSION
APPENDICES
REFERENCES & ACKNOWLEDGEMENTS
DATA PREPARATION METHODS
DATA PREPARATION RESULTS & DISCUSSION
PRELIMINARY ANALYSIS