China Numbers
March 28, 2019
December 2018 marked the 40th anniversary of China's Economic Reform, also known as the Opening of China, introduced by Deng Xiaoping. The growth of China in terms of gross domestic product (GDP), population, and even the size of some state-owned enterprises (SOEs) as well as private enterprises is colossal and the numbers defining the magnitude of China are staggering.
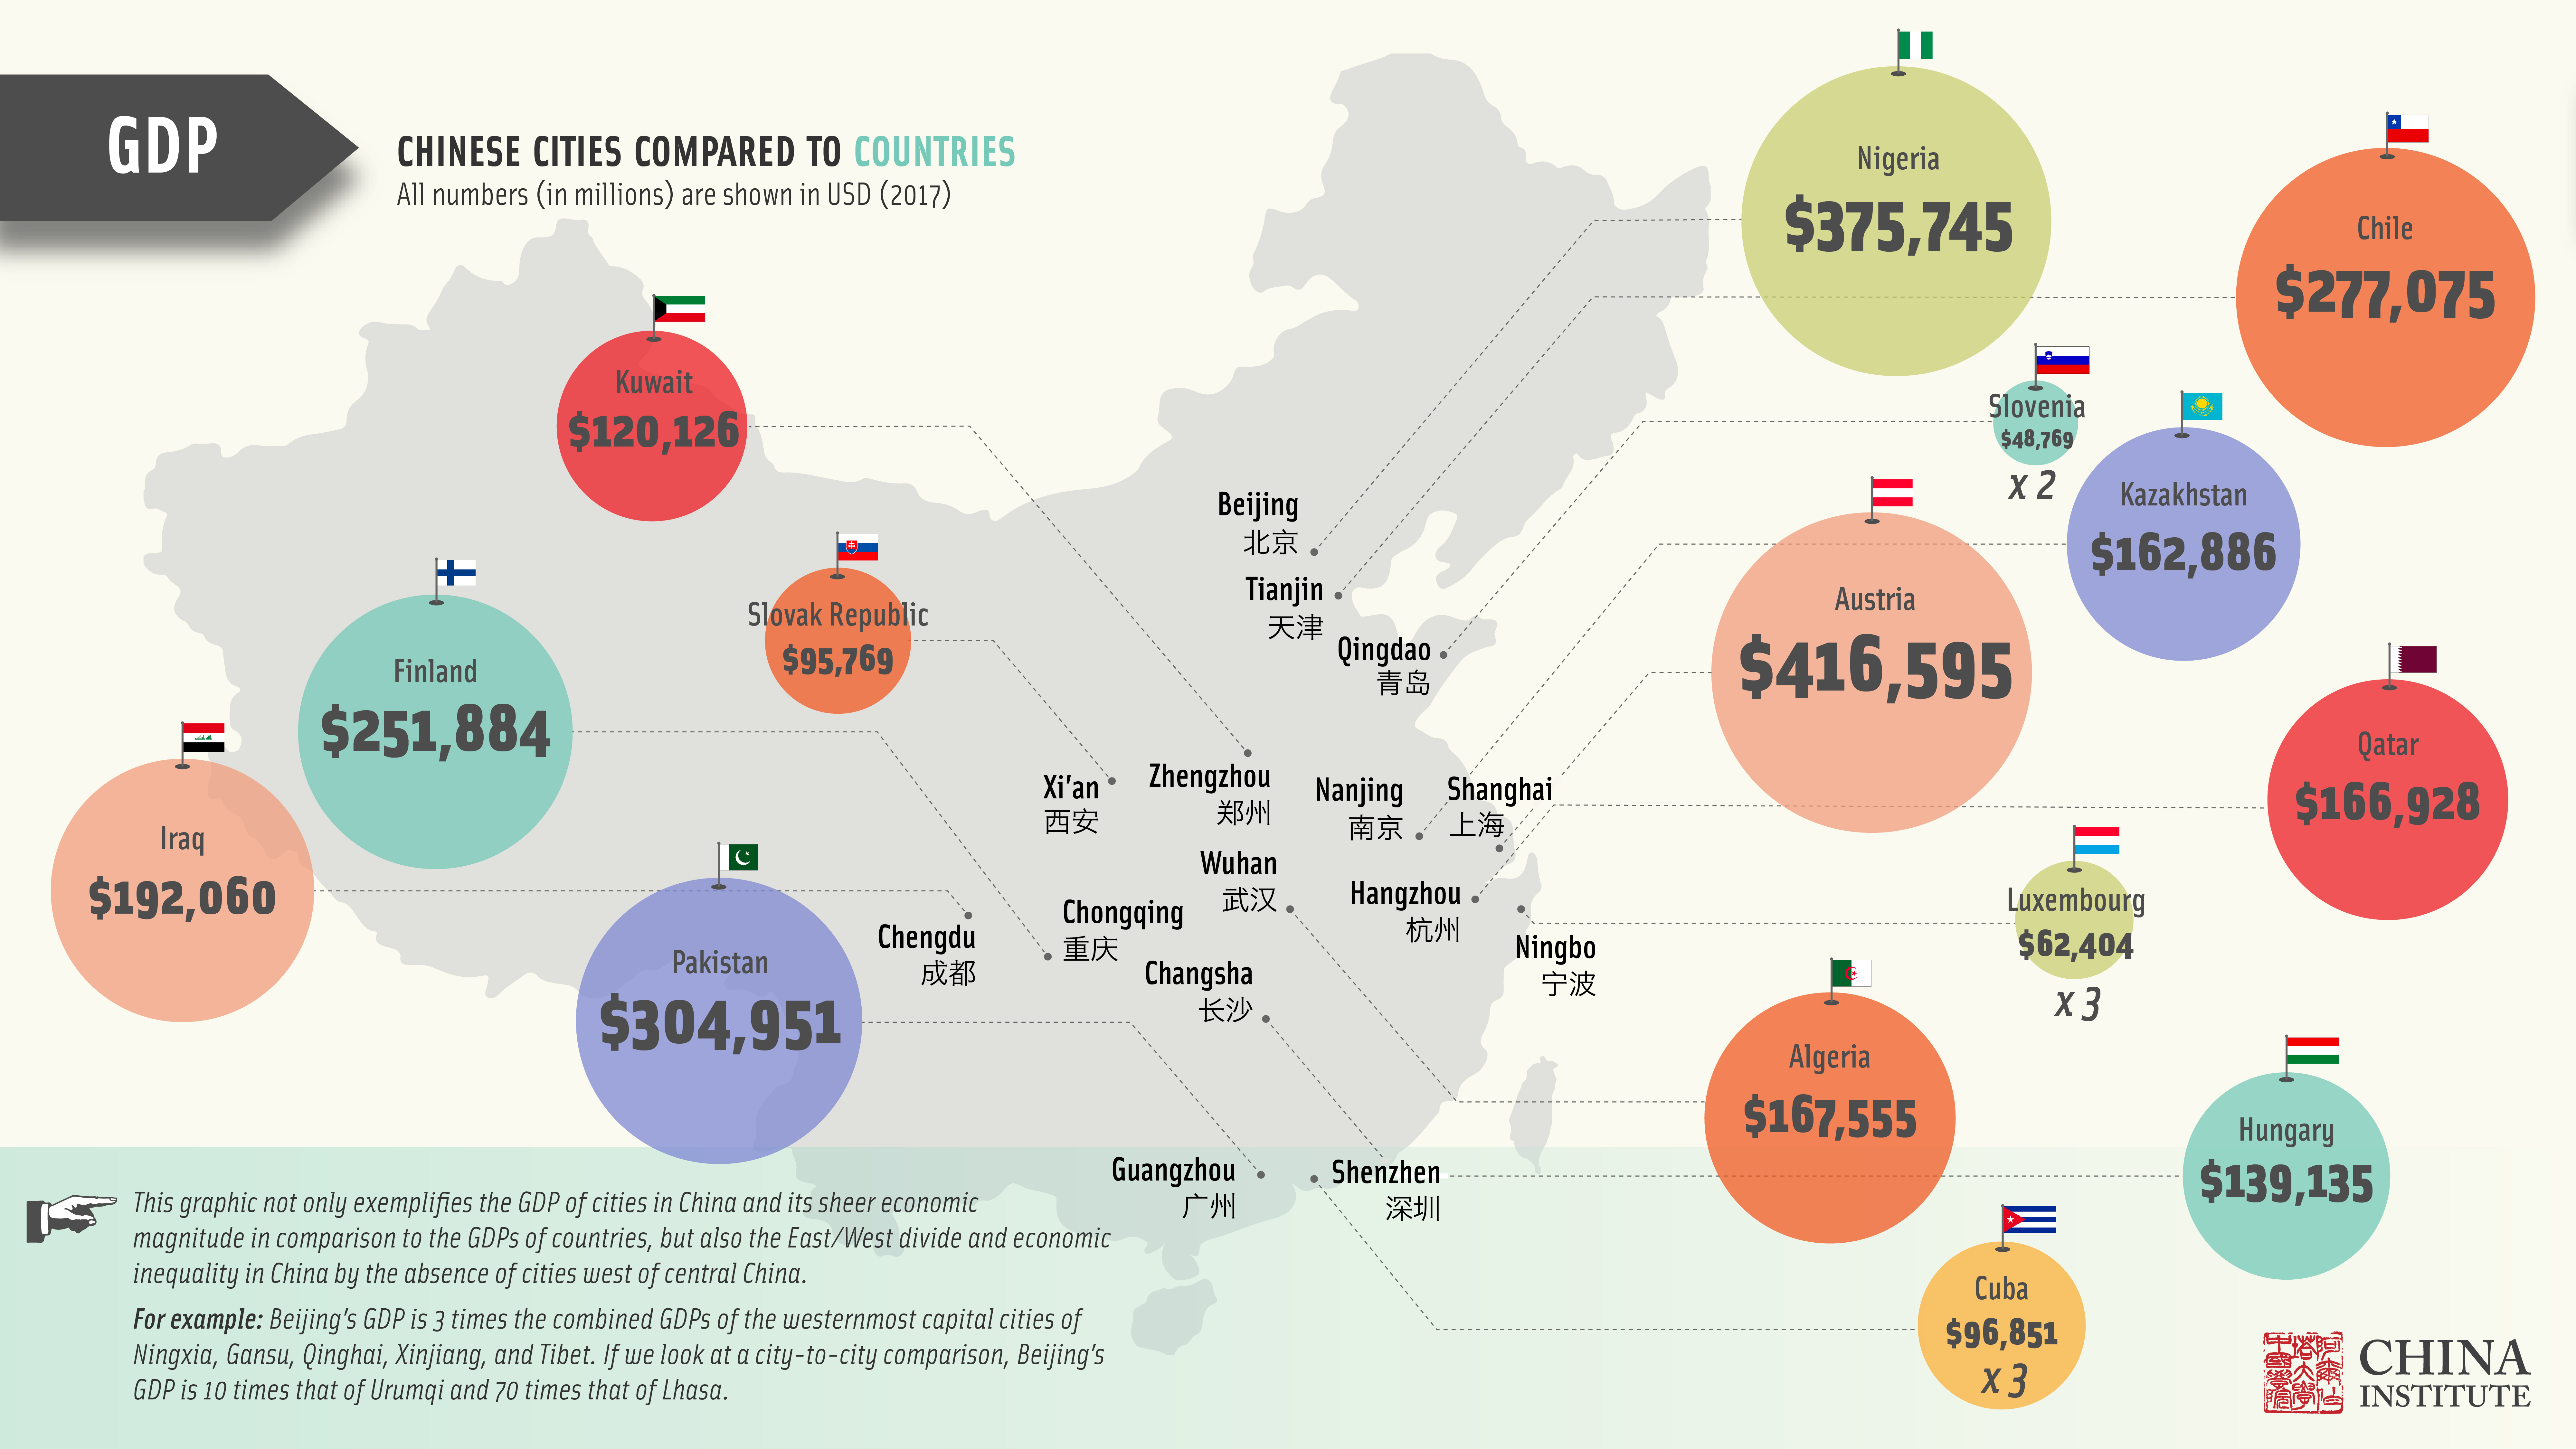
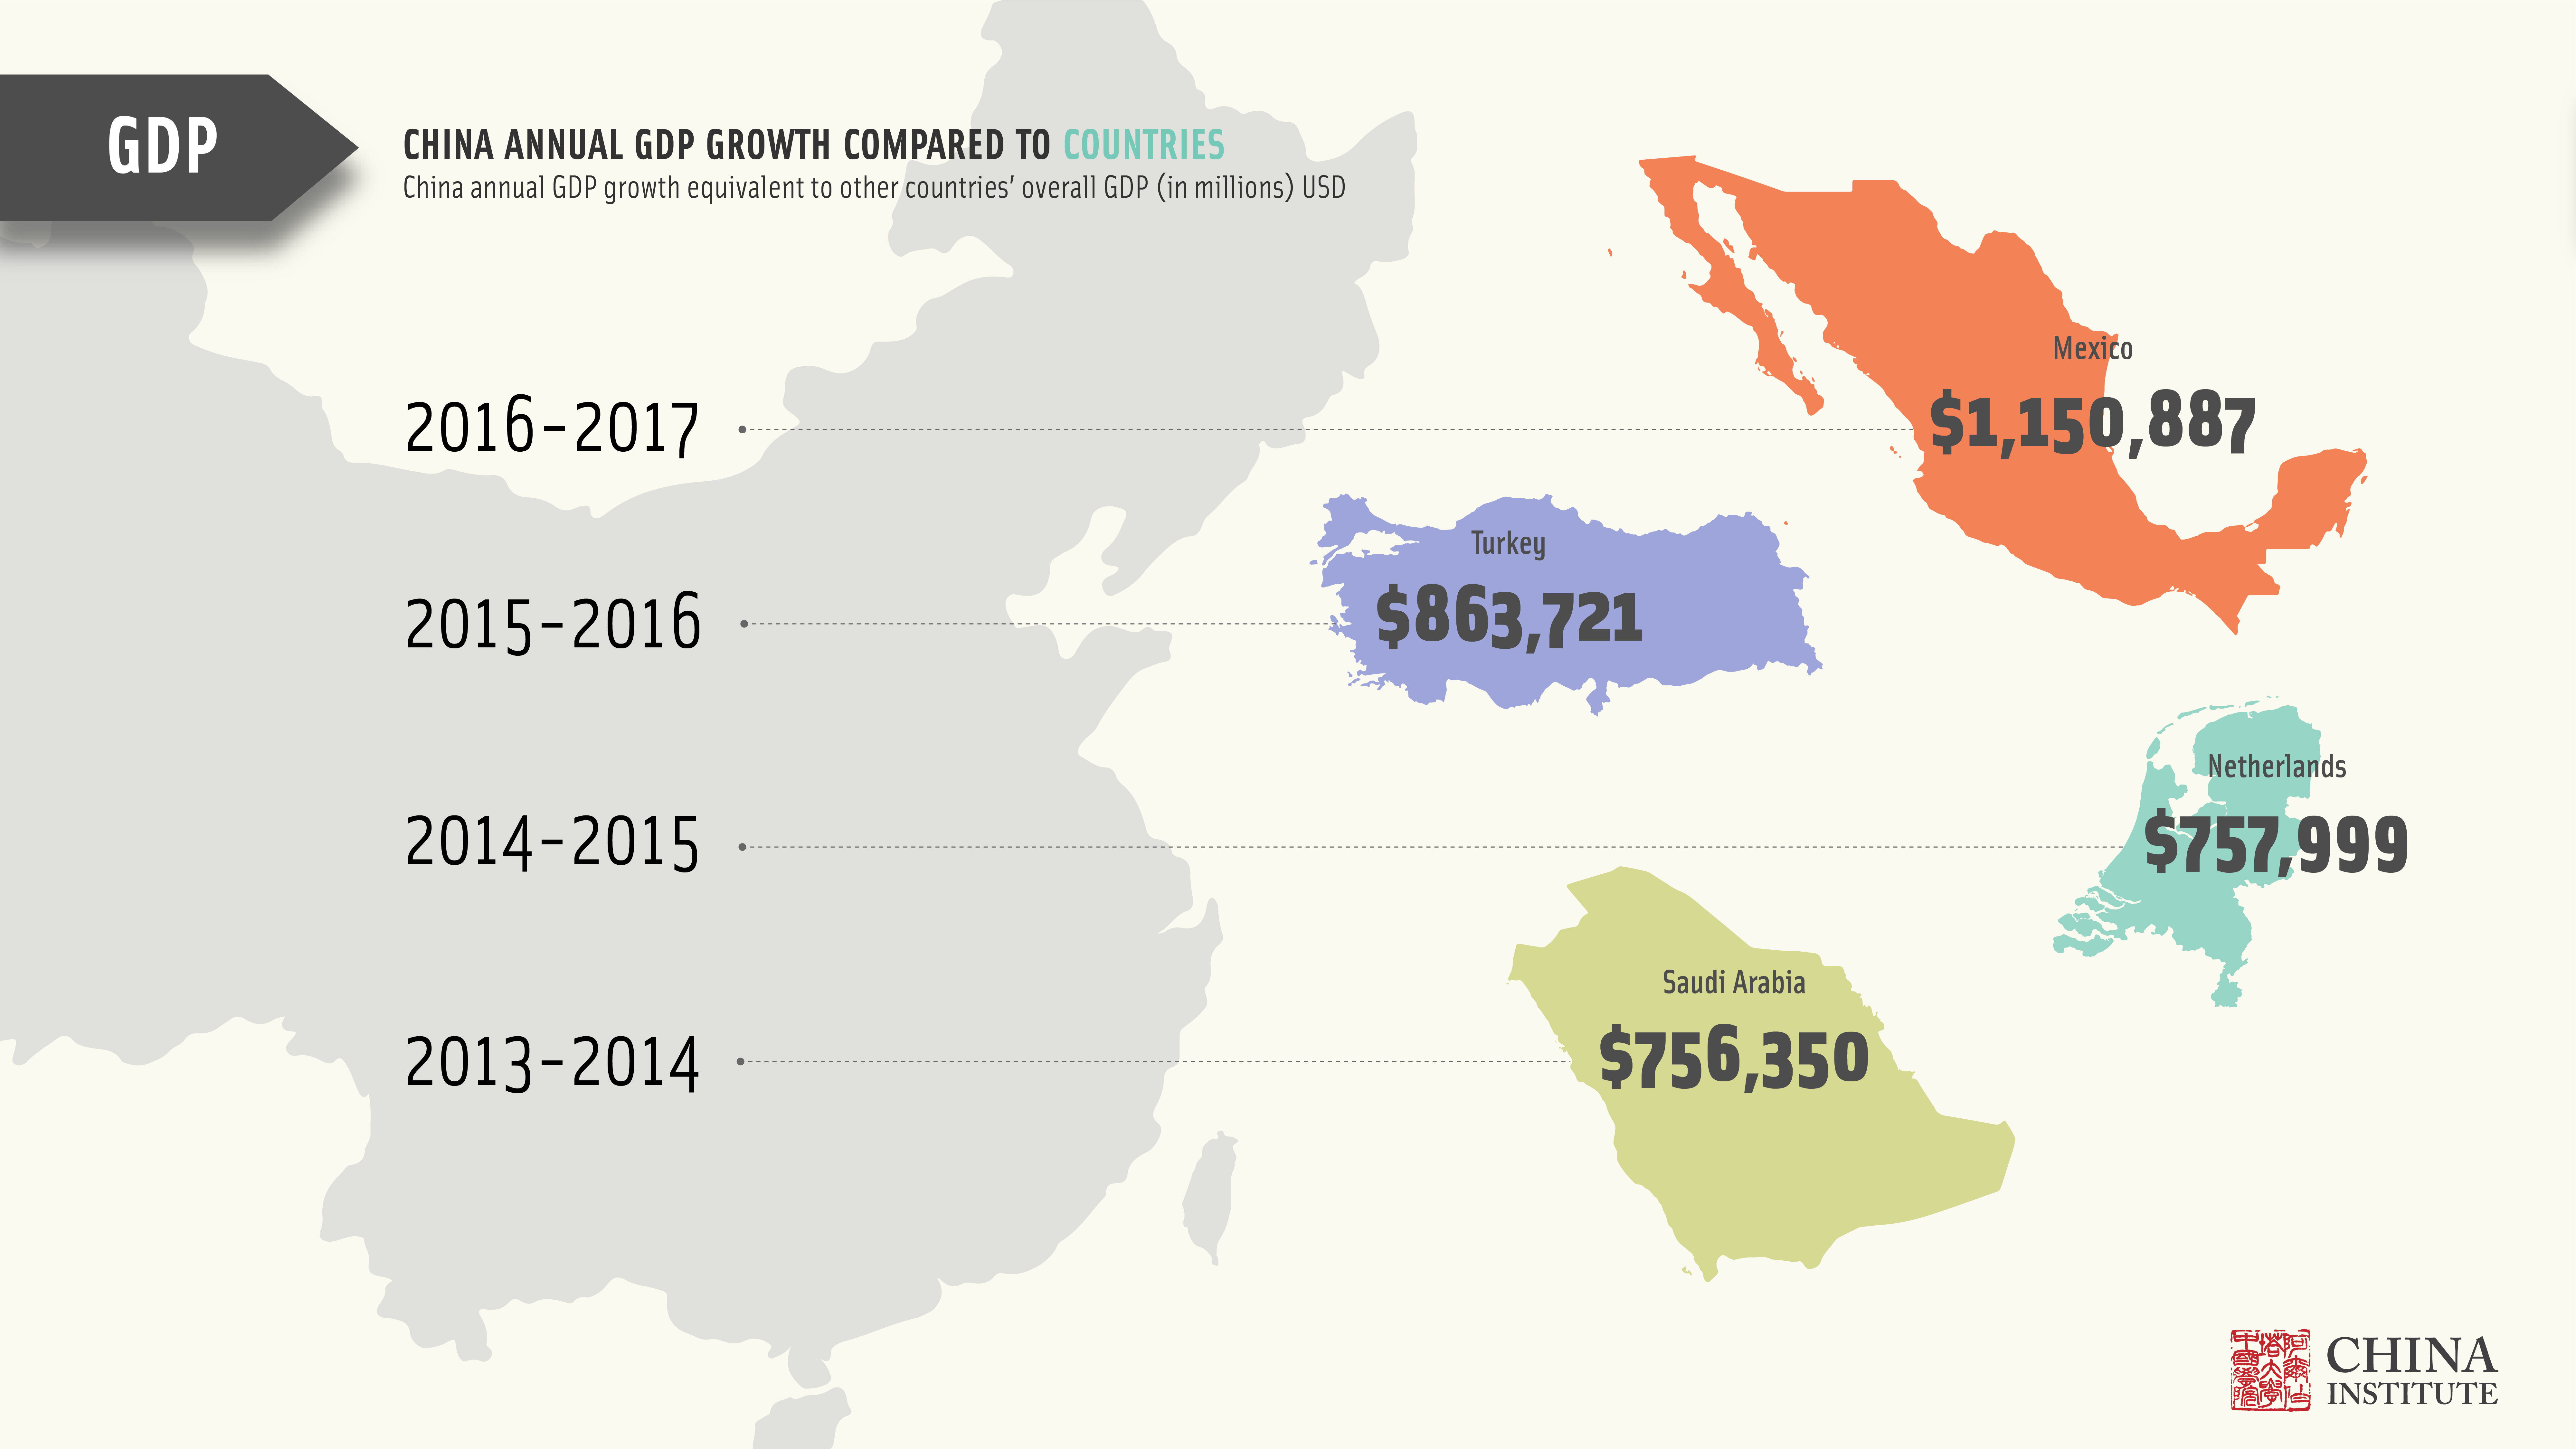
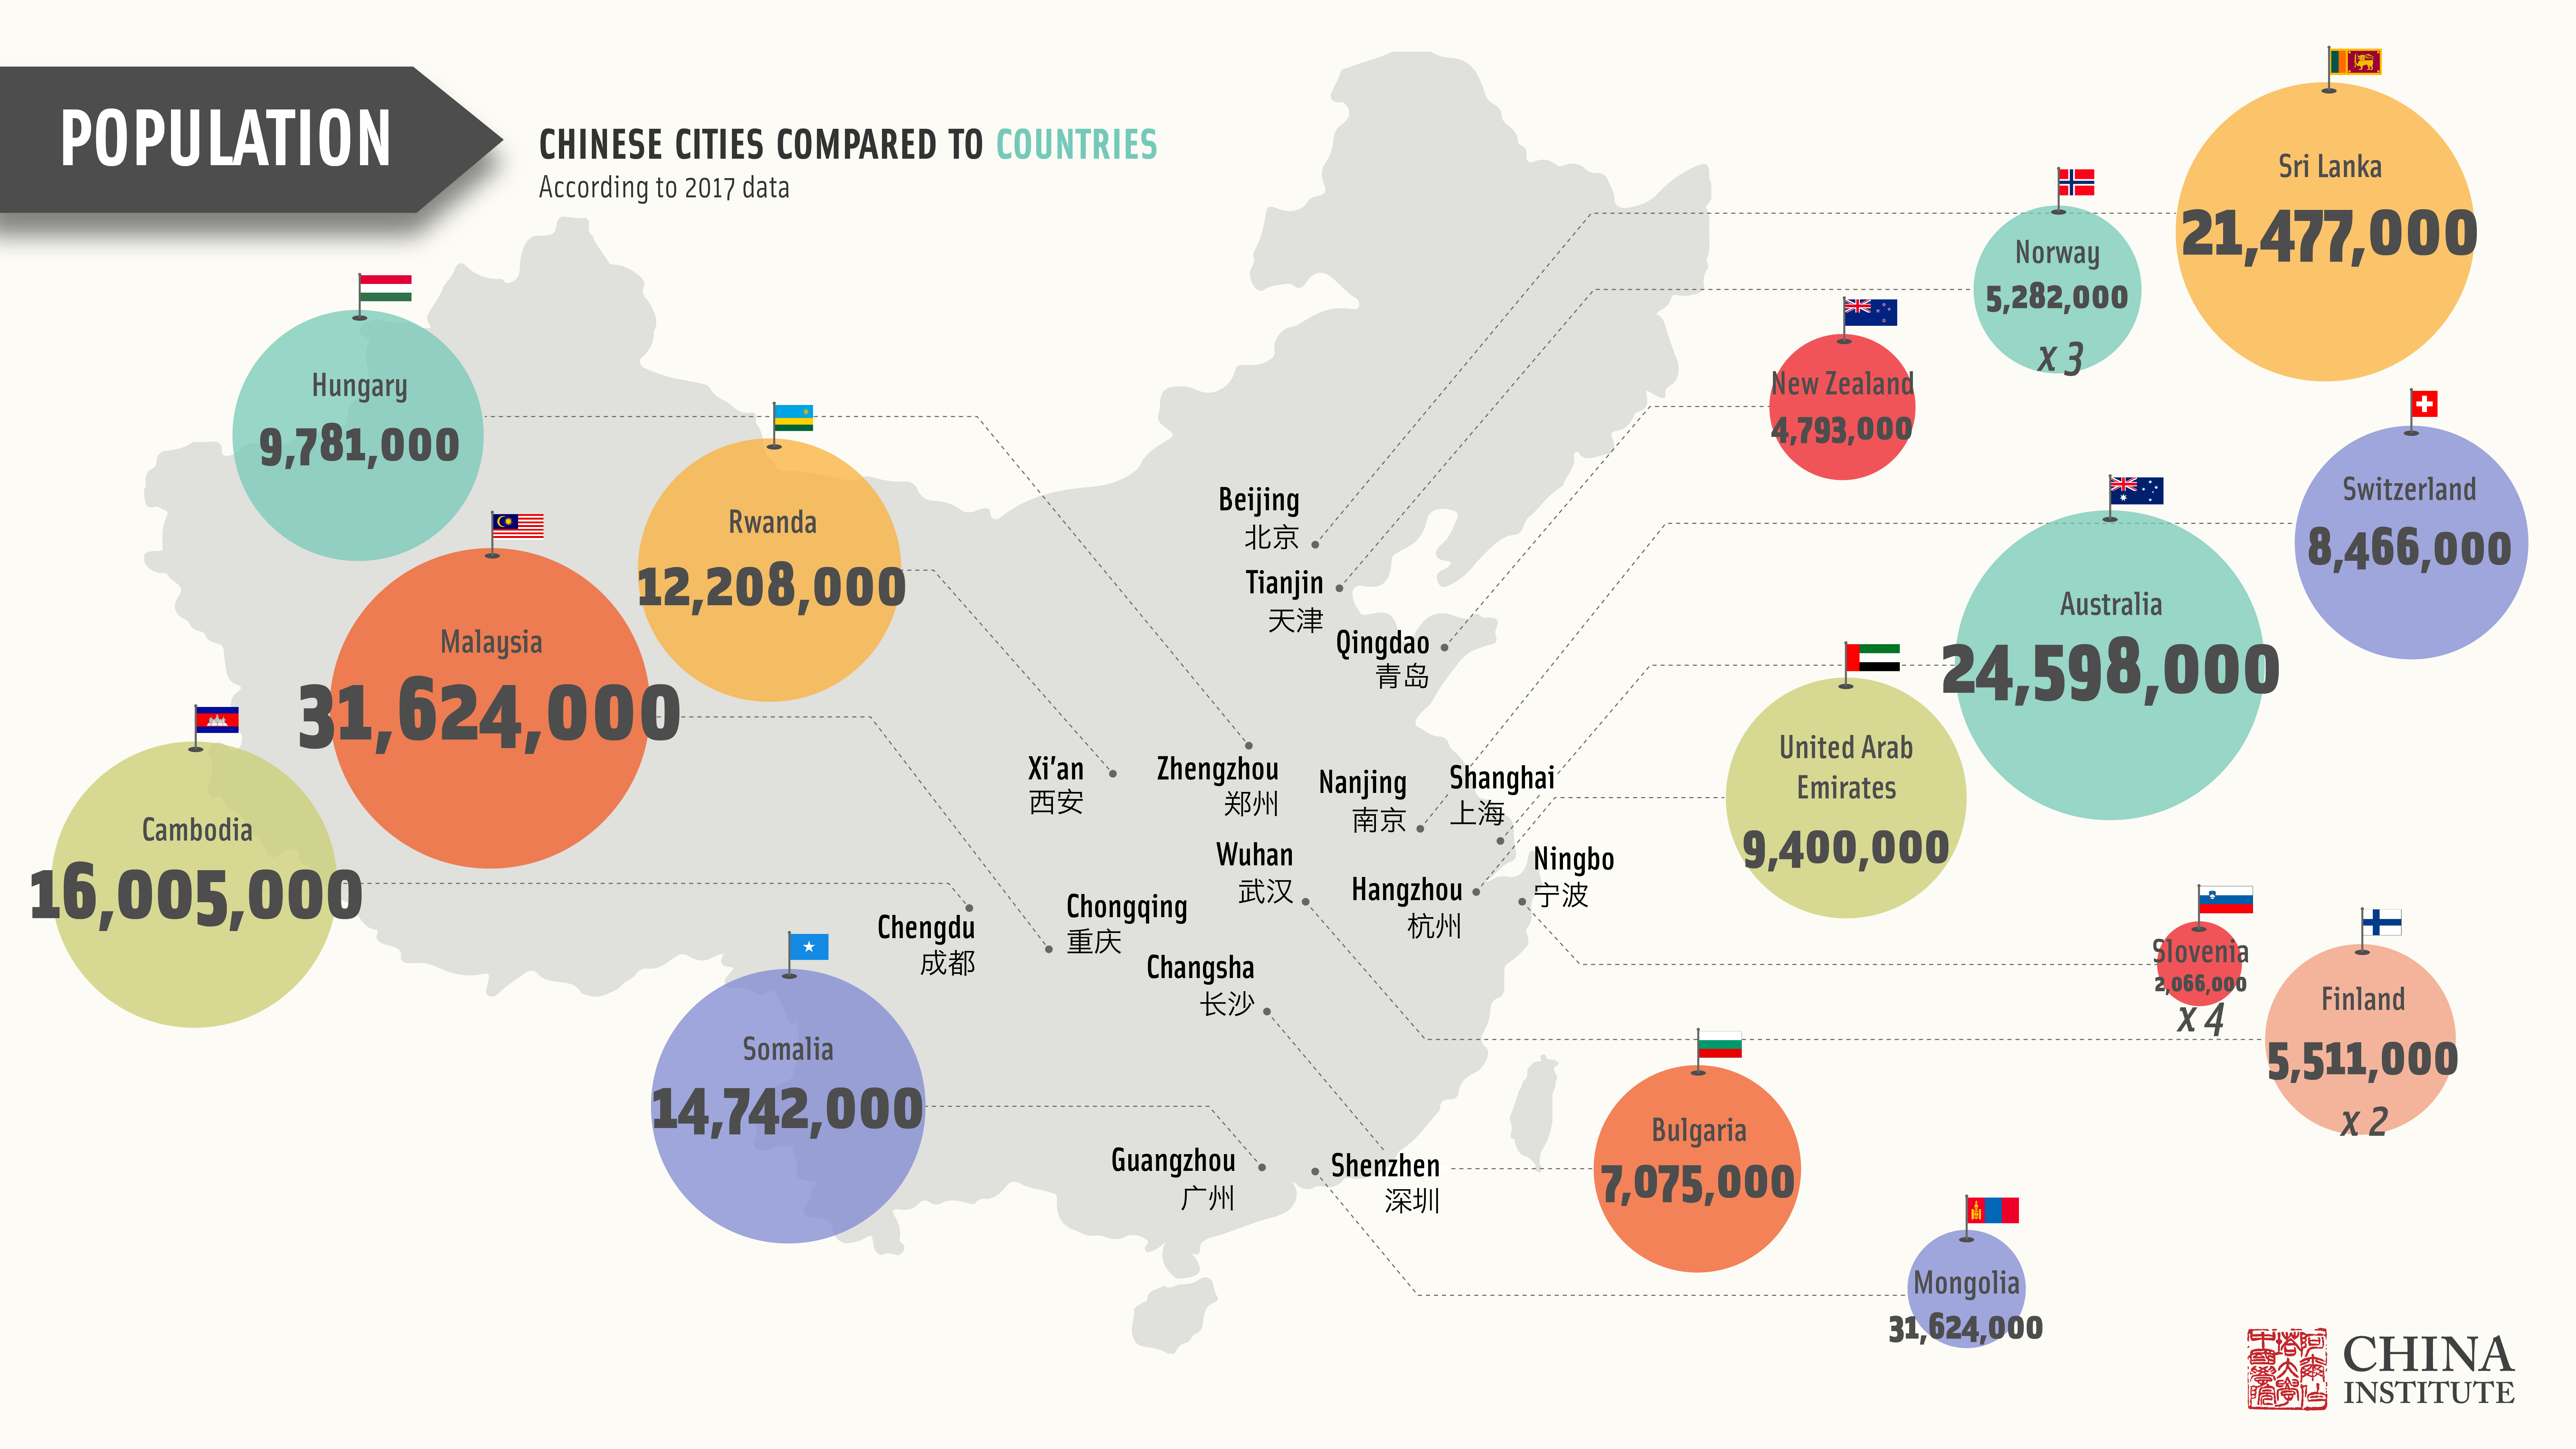
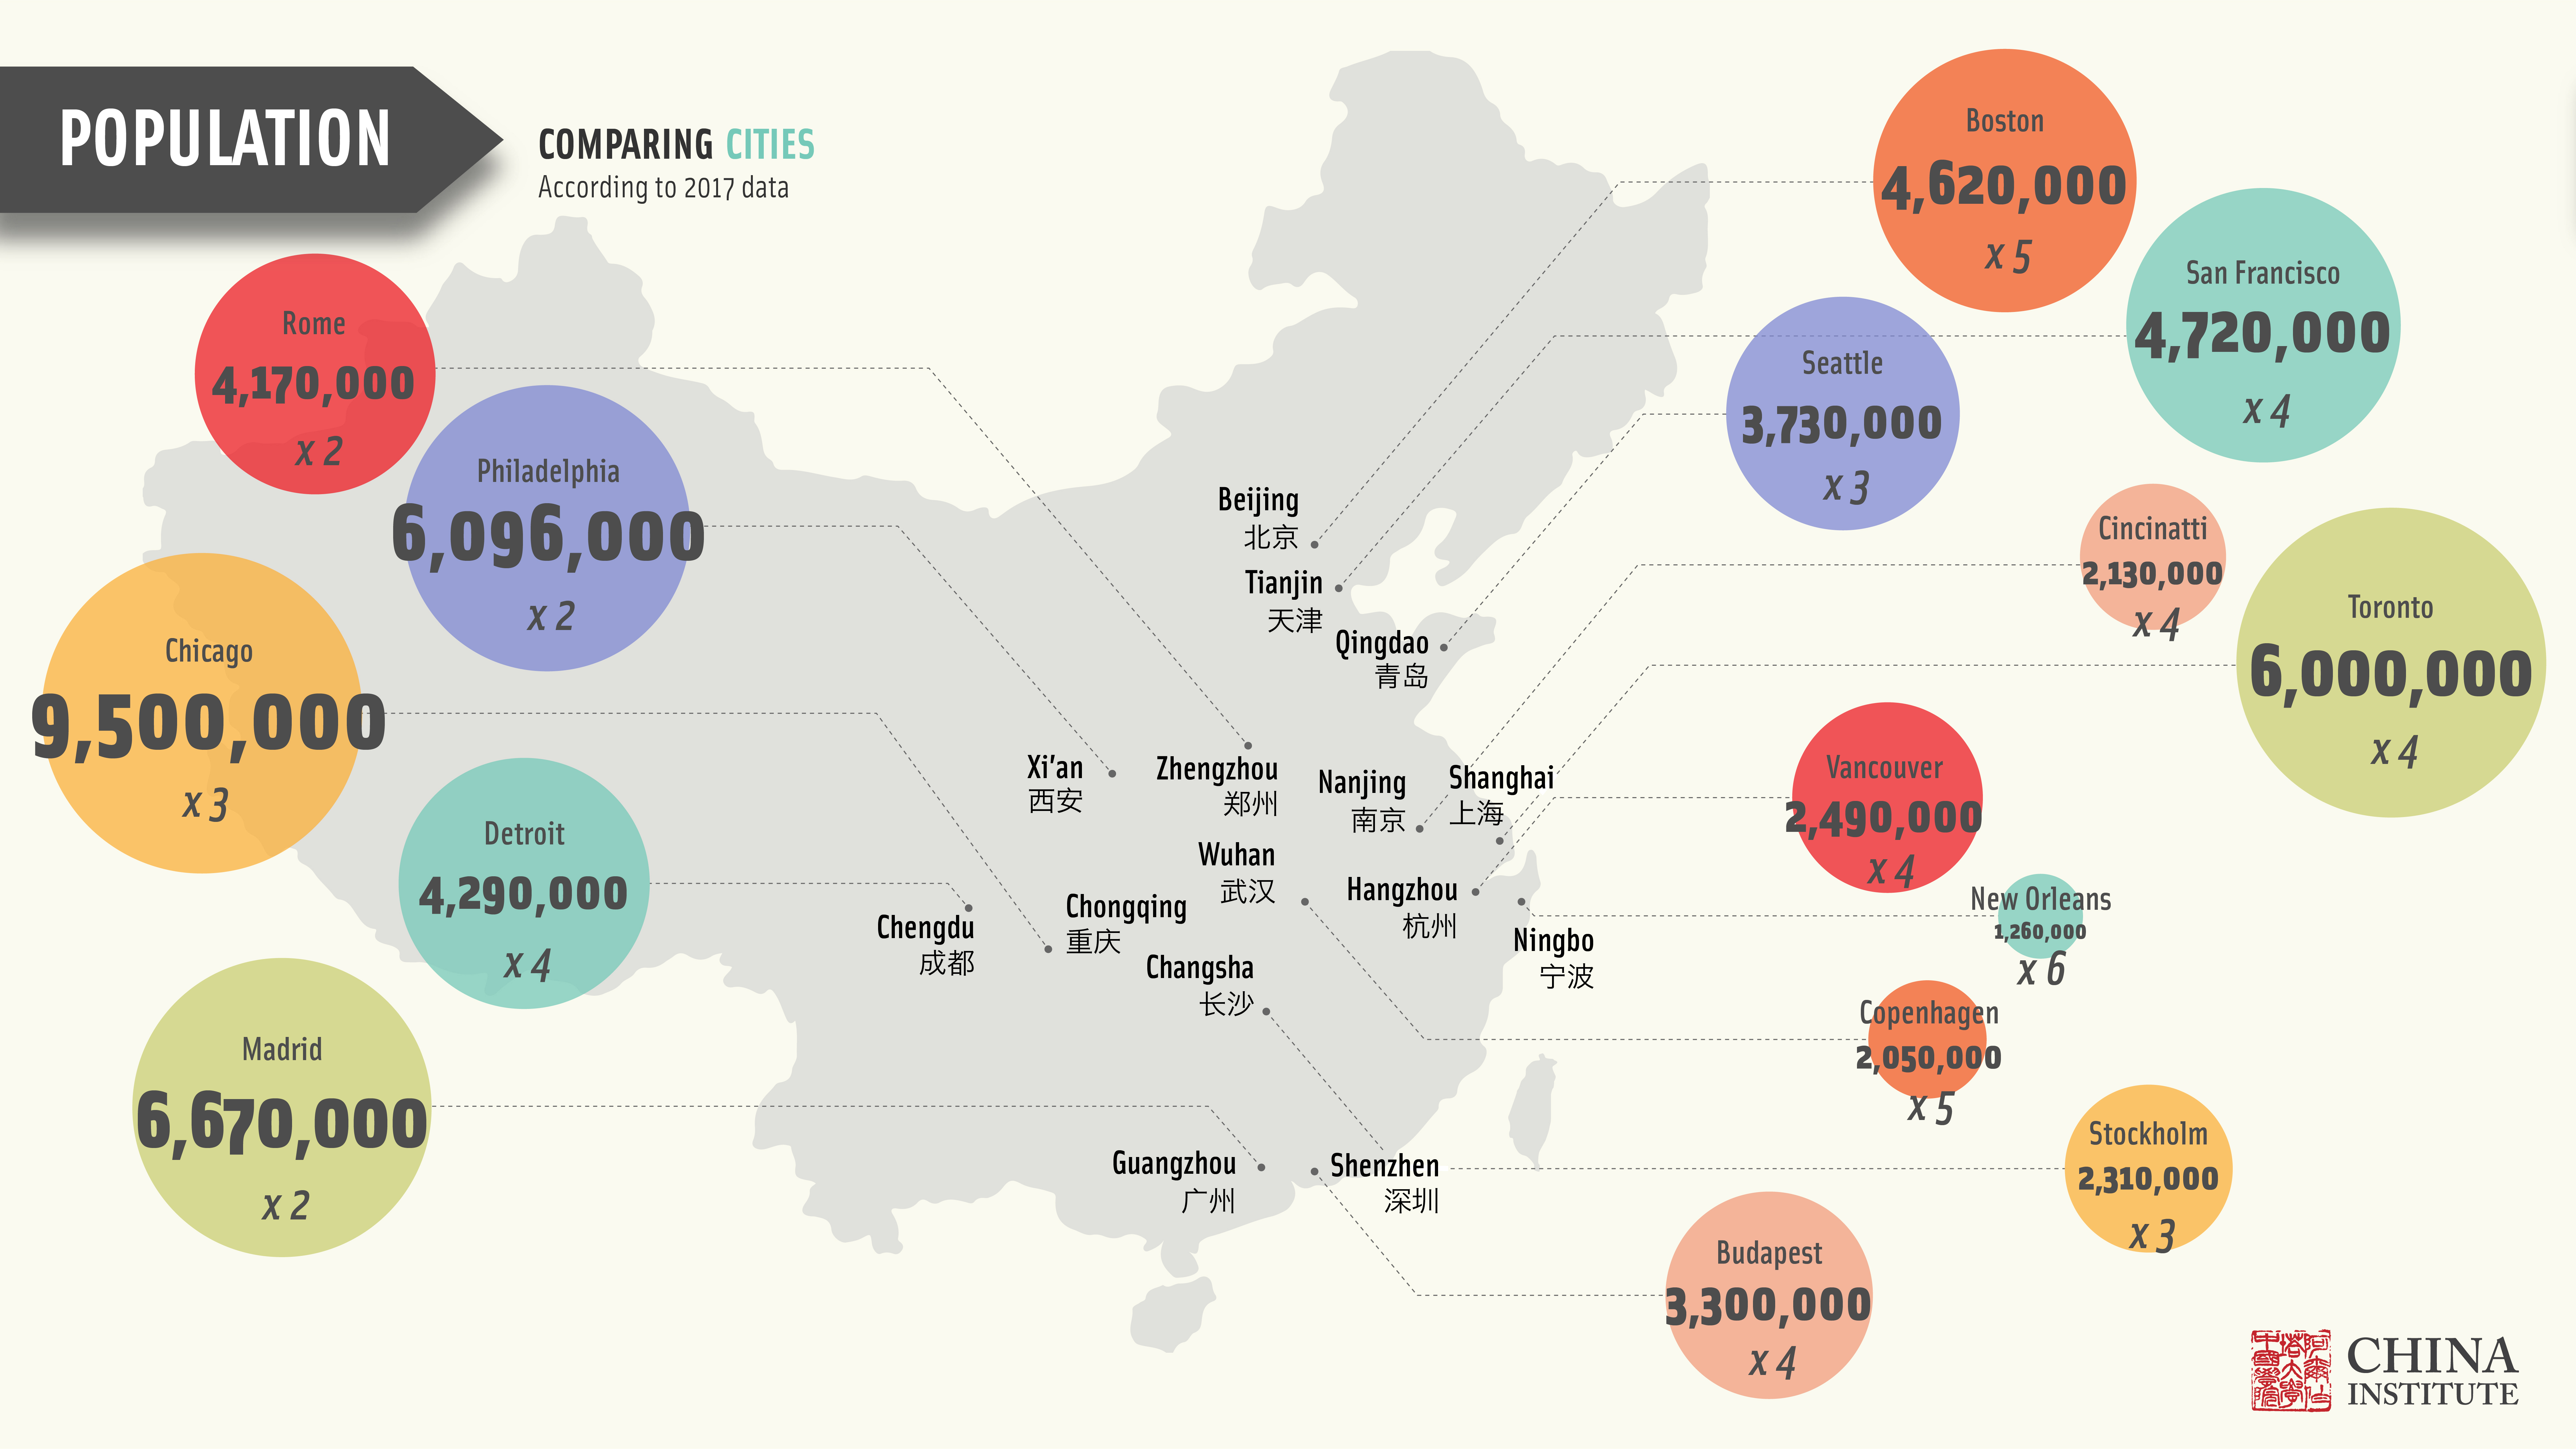
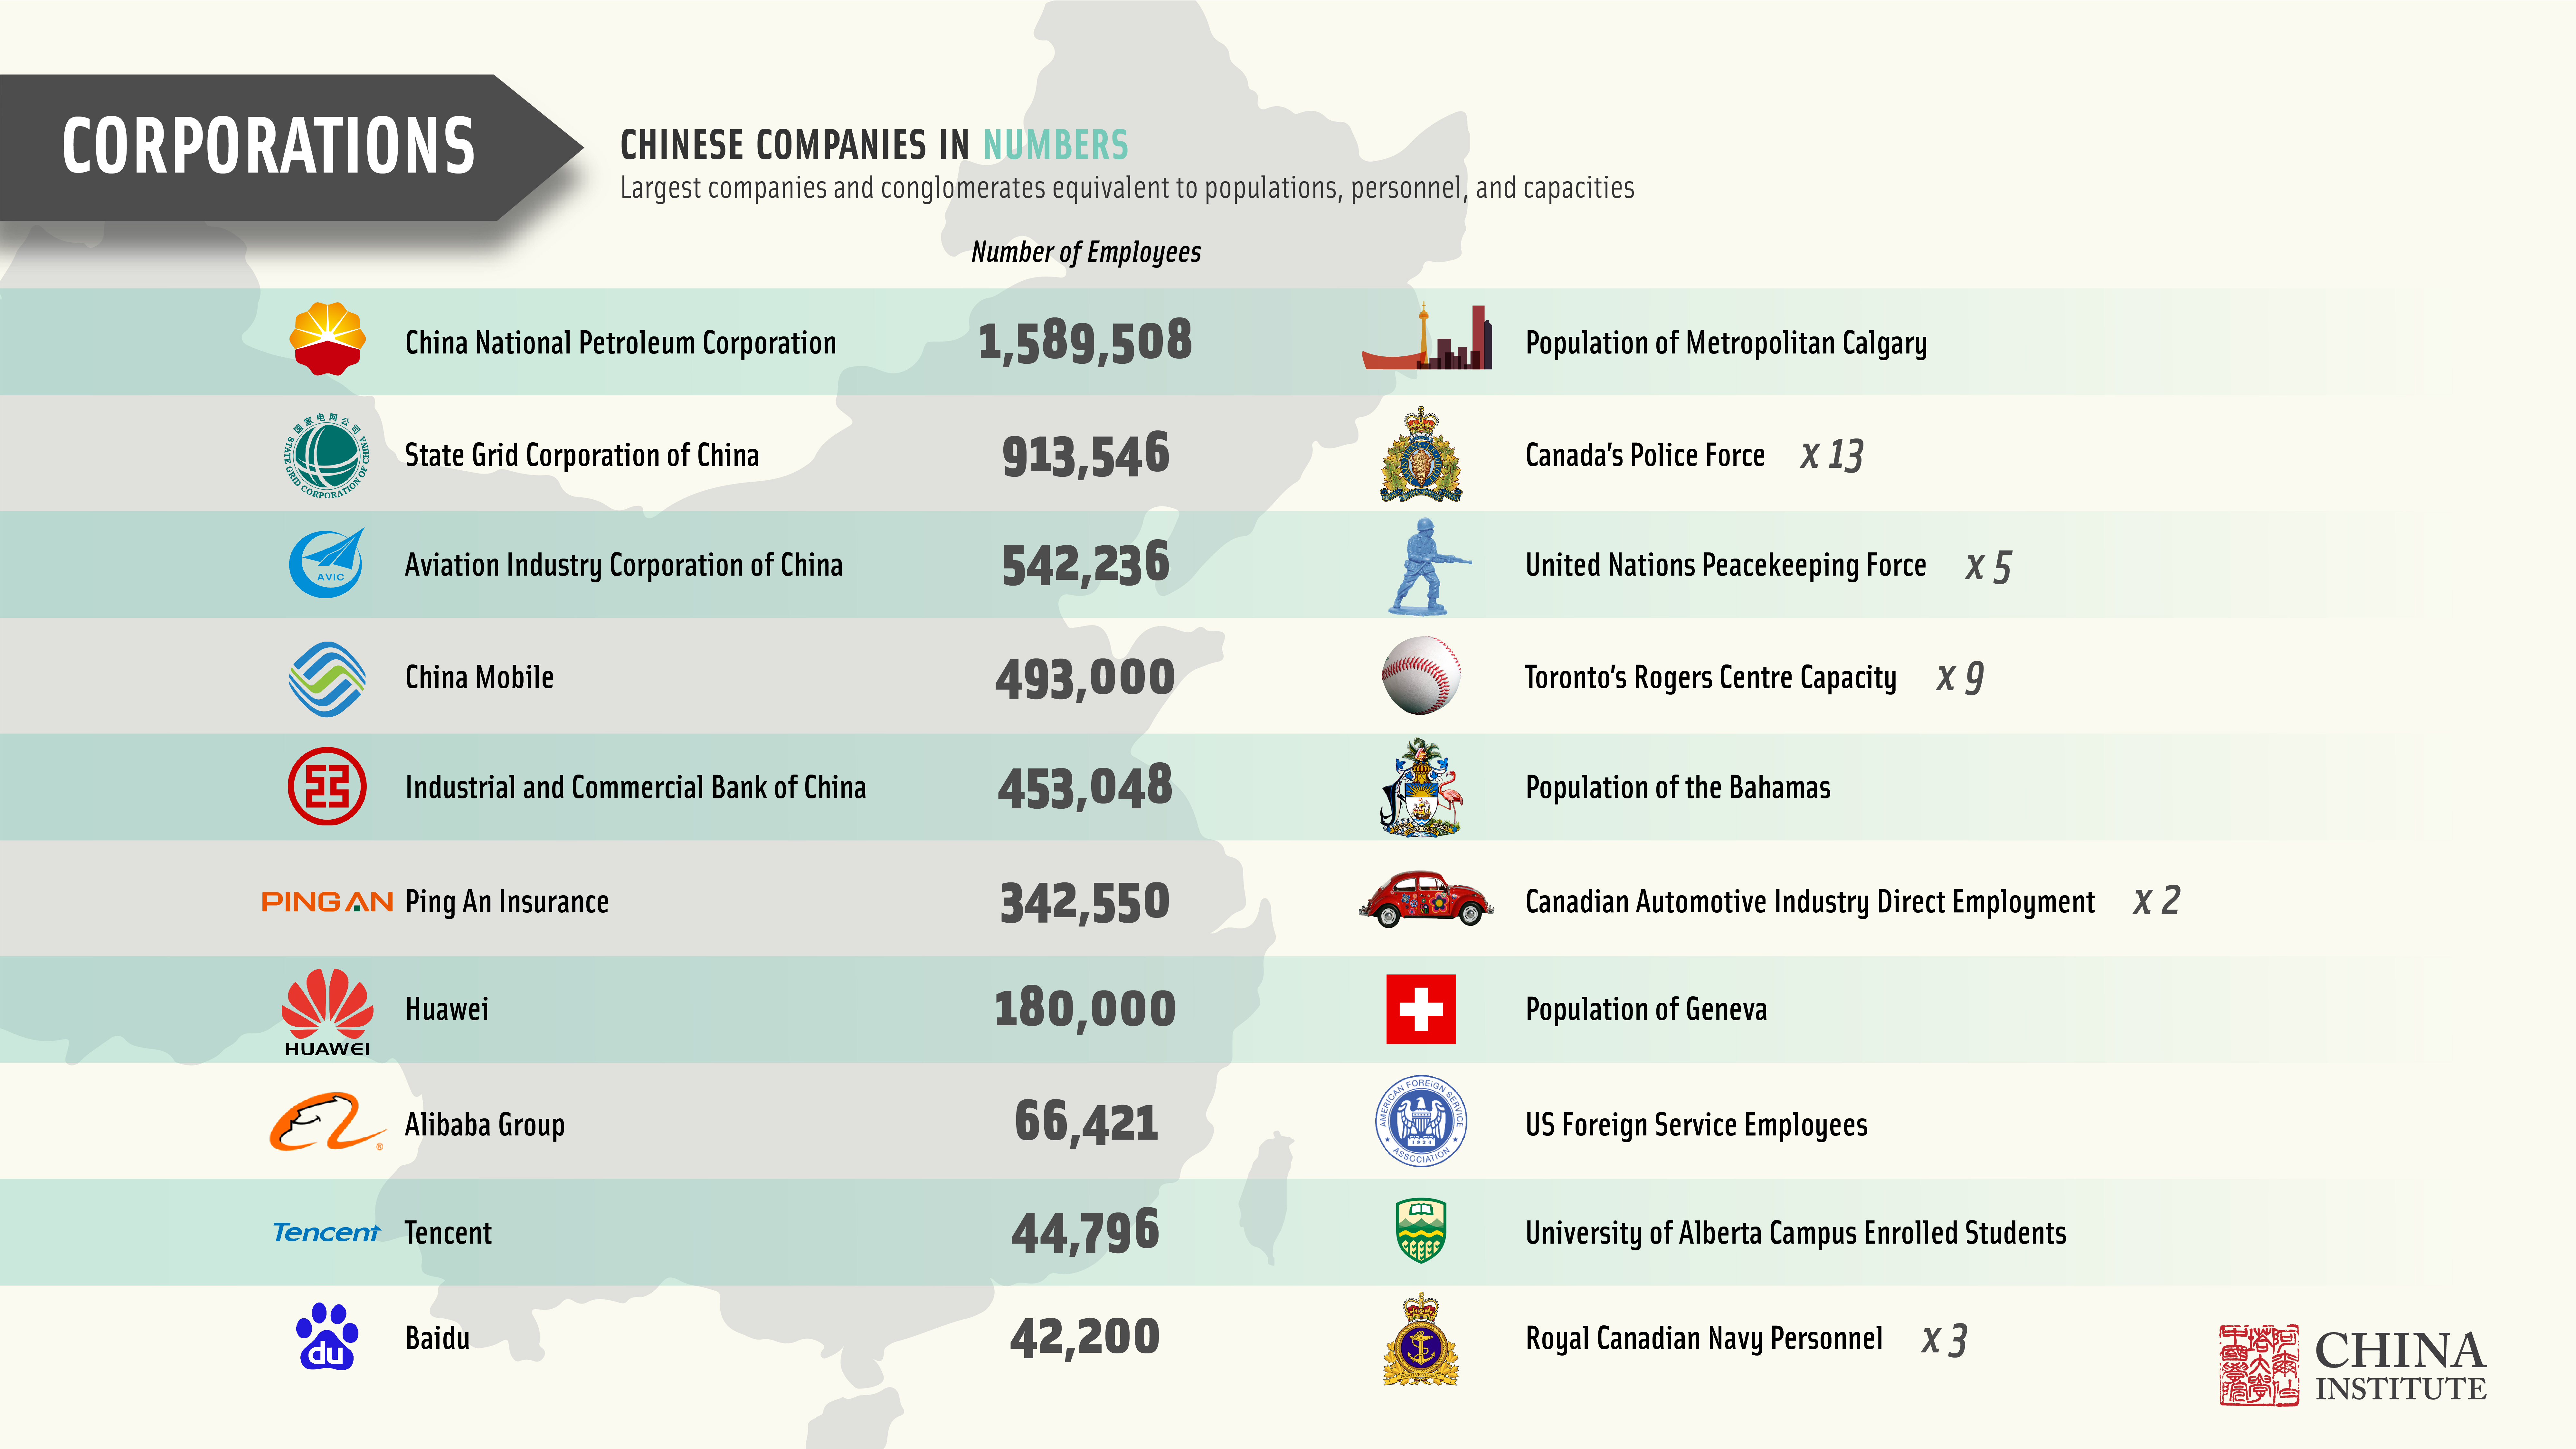
The data visualization, referred to as "China Numbers," presents three key areas of China's growth: GDP, population, and the size of large Chinese enterprises. Altogether, five data sets are included in the project: (1) Annual GDP compared to other countries; (2) City level GDP compared to countries; (3) Population of cities compared to countries; (4) Population of cities compared to other cities; and (5) The number of employees in large Chinese enterprises with equivalents to populations, personnel, and capacities.
The visualization facilitates a clear understanding of key numbers in China's growth as a snapshot of its current position. It highlights the East/West divide, not only in terms of the large economic gaps, but also in terms of what is not included in the data set. It illustrates the incongruous growth of Central and East China at the expense of the westernmost provinces and autonomous regions. It also shows that even though China has free and open markets, a large number of companies are still fully or partially held by the State.
Finally, the numbers are often lost in other charts, are part of poorly constructed visualizations, or buried deeply in reports and papers, and so on. As such, the aim of "China Numbers" data visualization is simply to highlight numbers, putting them into something meaningful and easy to understand.

Research Team
Dr Scott N Romaniuk, Postdoctoral Research Fellow; Dr Sadiq Javer, Postdoctoral Research Fellow; Liang Ma, Research Associate
Design
Genevieve Ongaro, Design and Communications Specialist