China Trade
November 2019
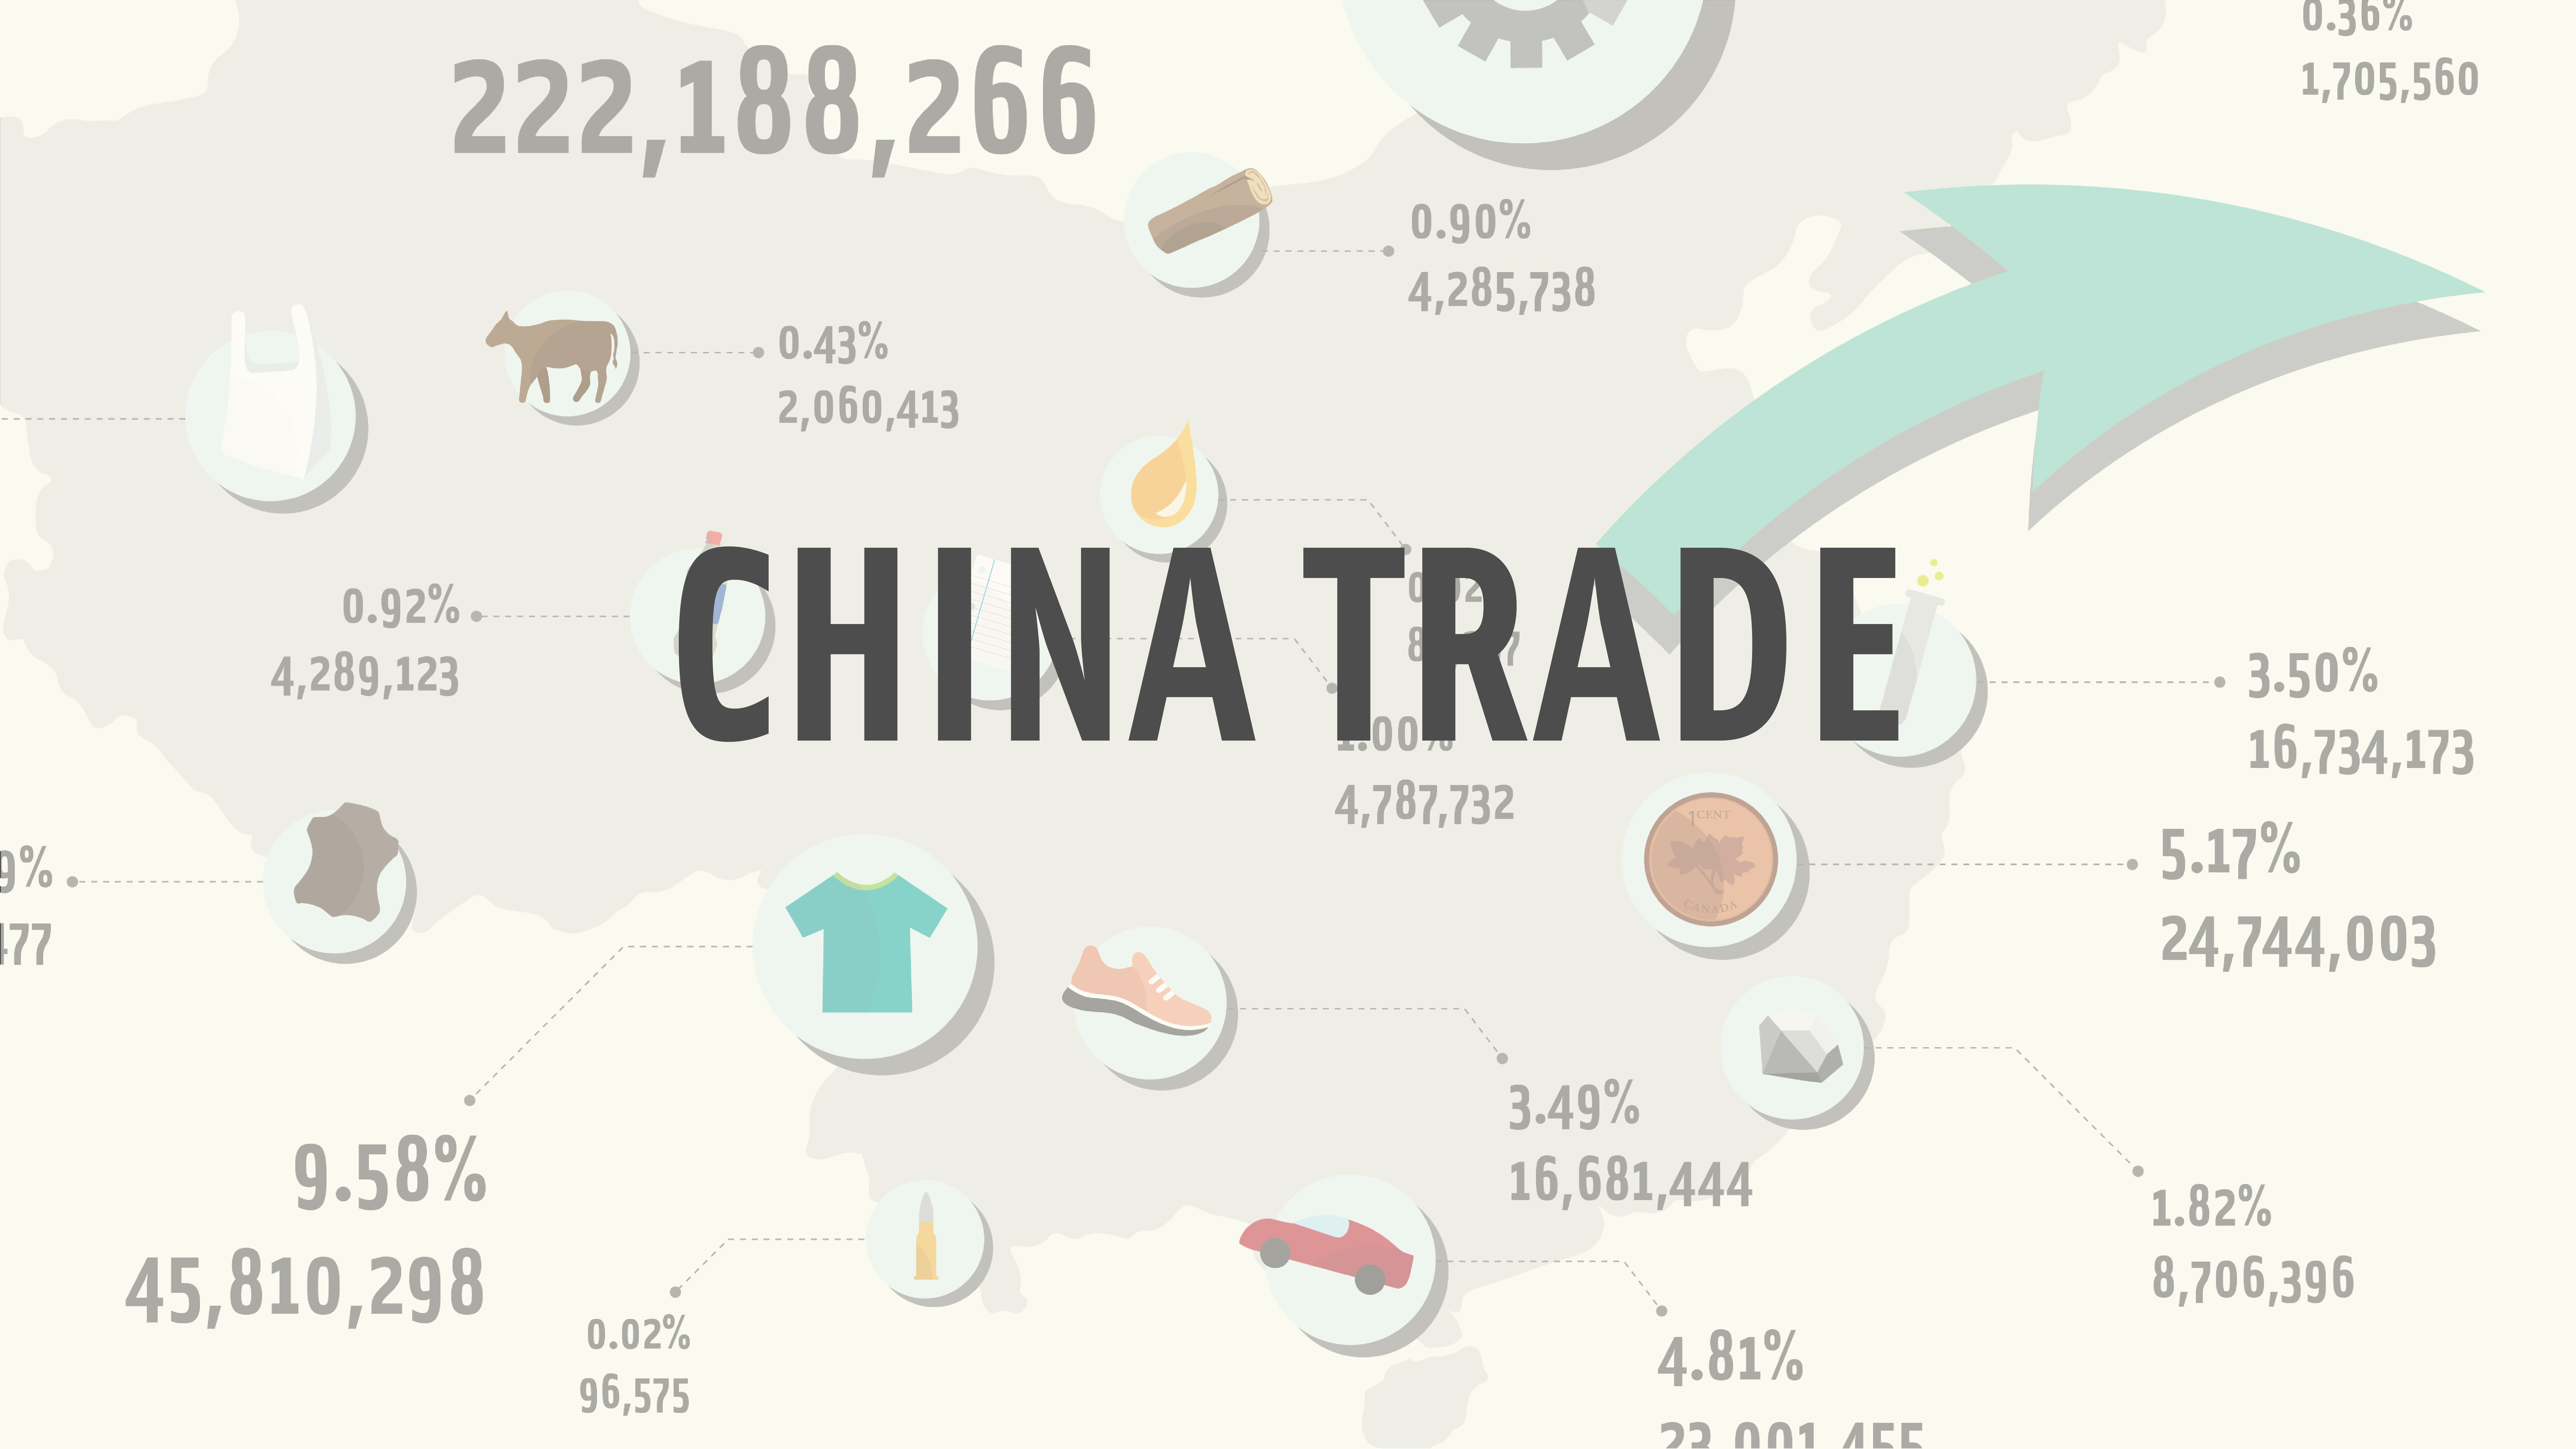
2018 marked both the 70th anniversary of China’s process of economic reform and the 17th anniversary of China joining the World Trade Organization (WTO). Since China joined the WTO in 2001, the country has made tremendous progress in the area of international trade, ranking 1st and 2nd in global goods exports and imports, respectively, and replacing the United States (US) as the largest global trader of goods in 2013.
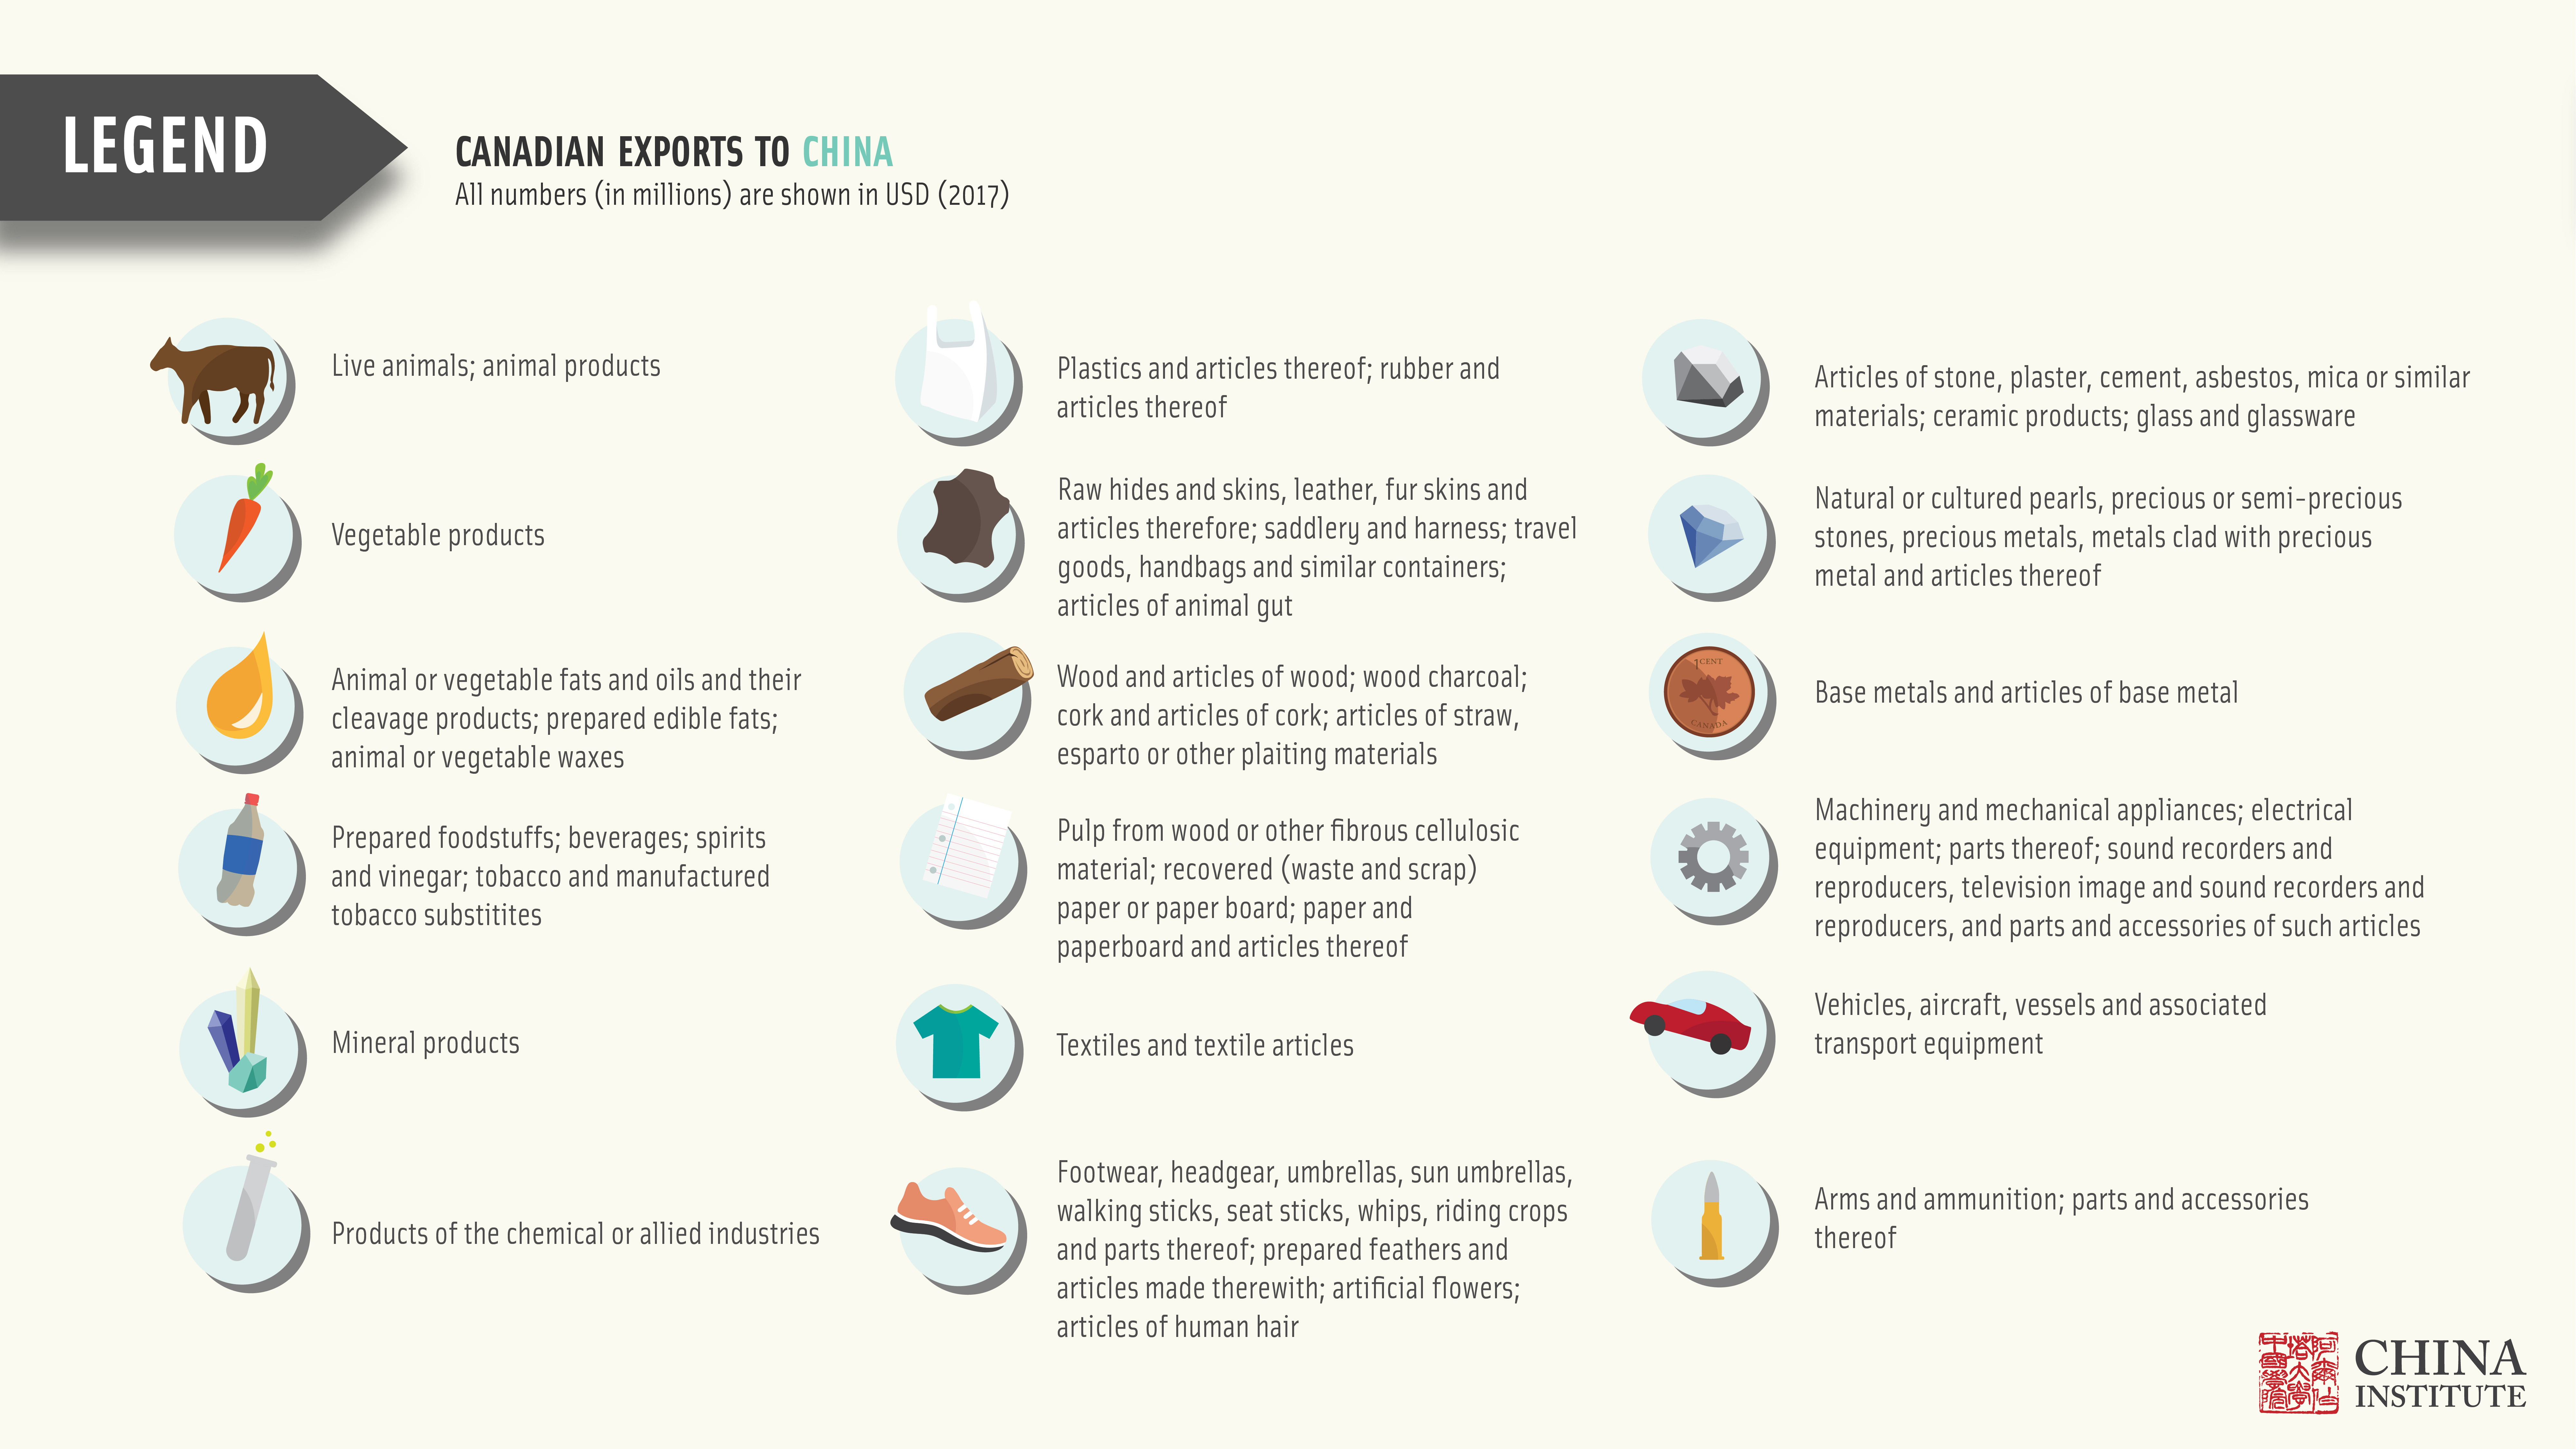
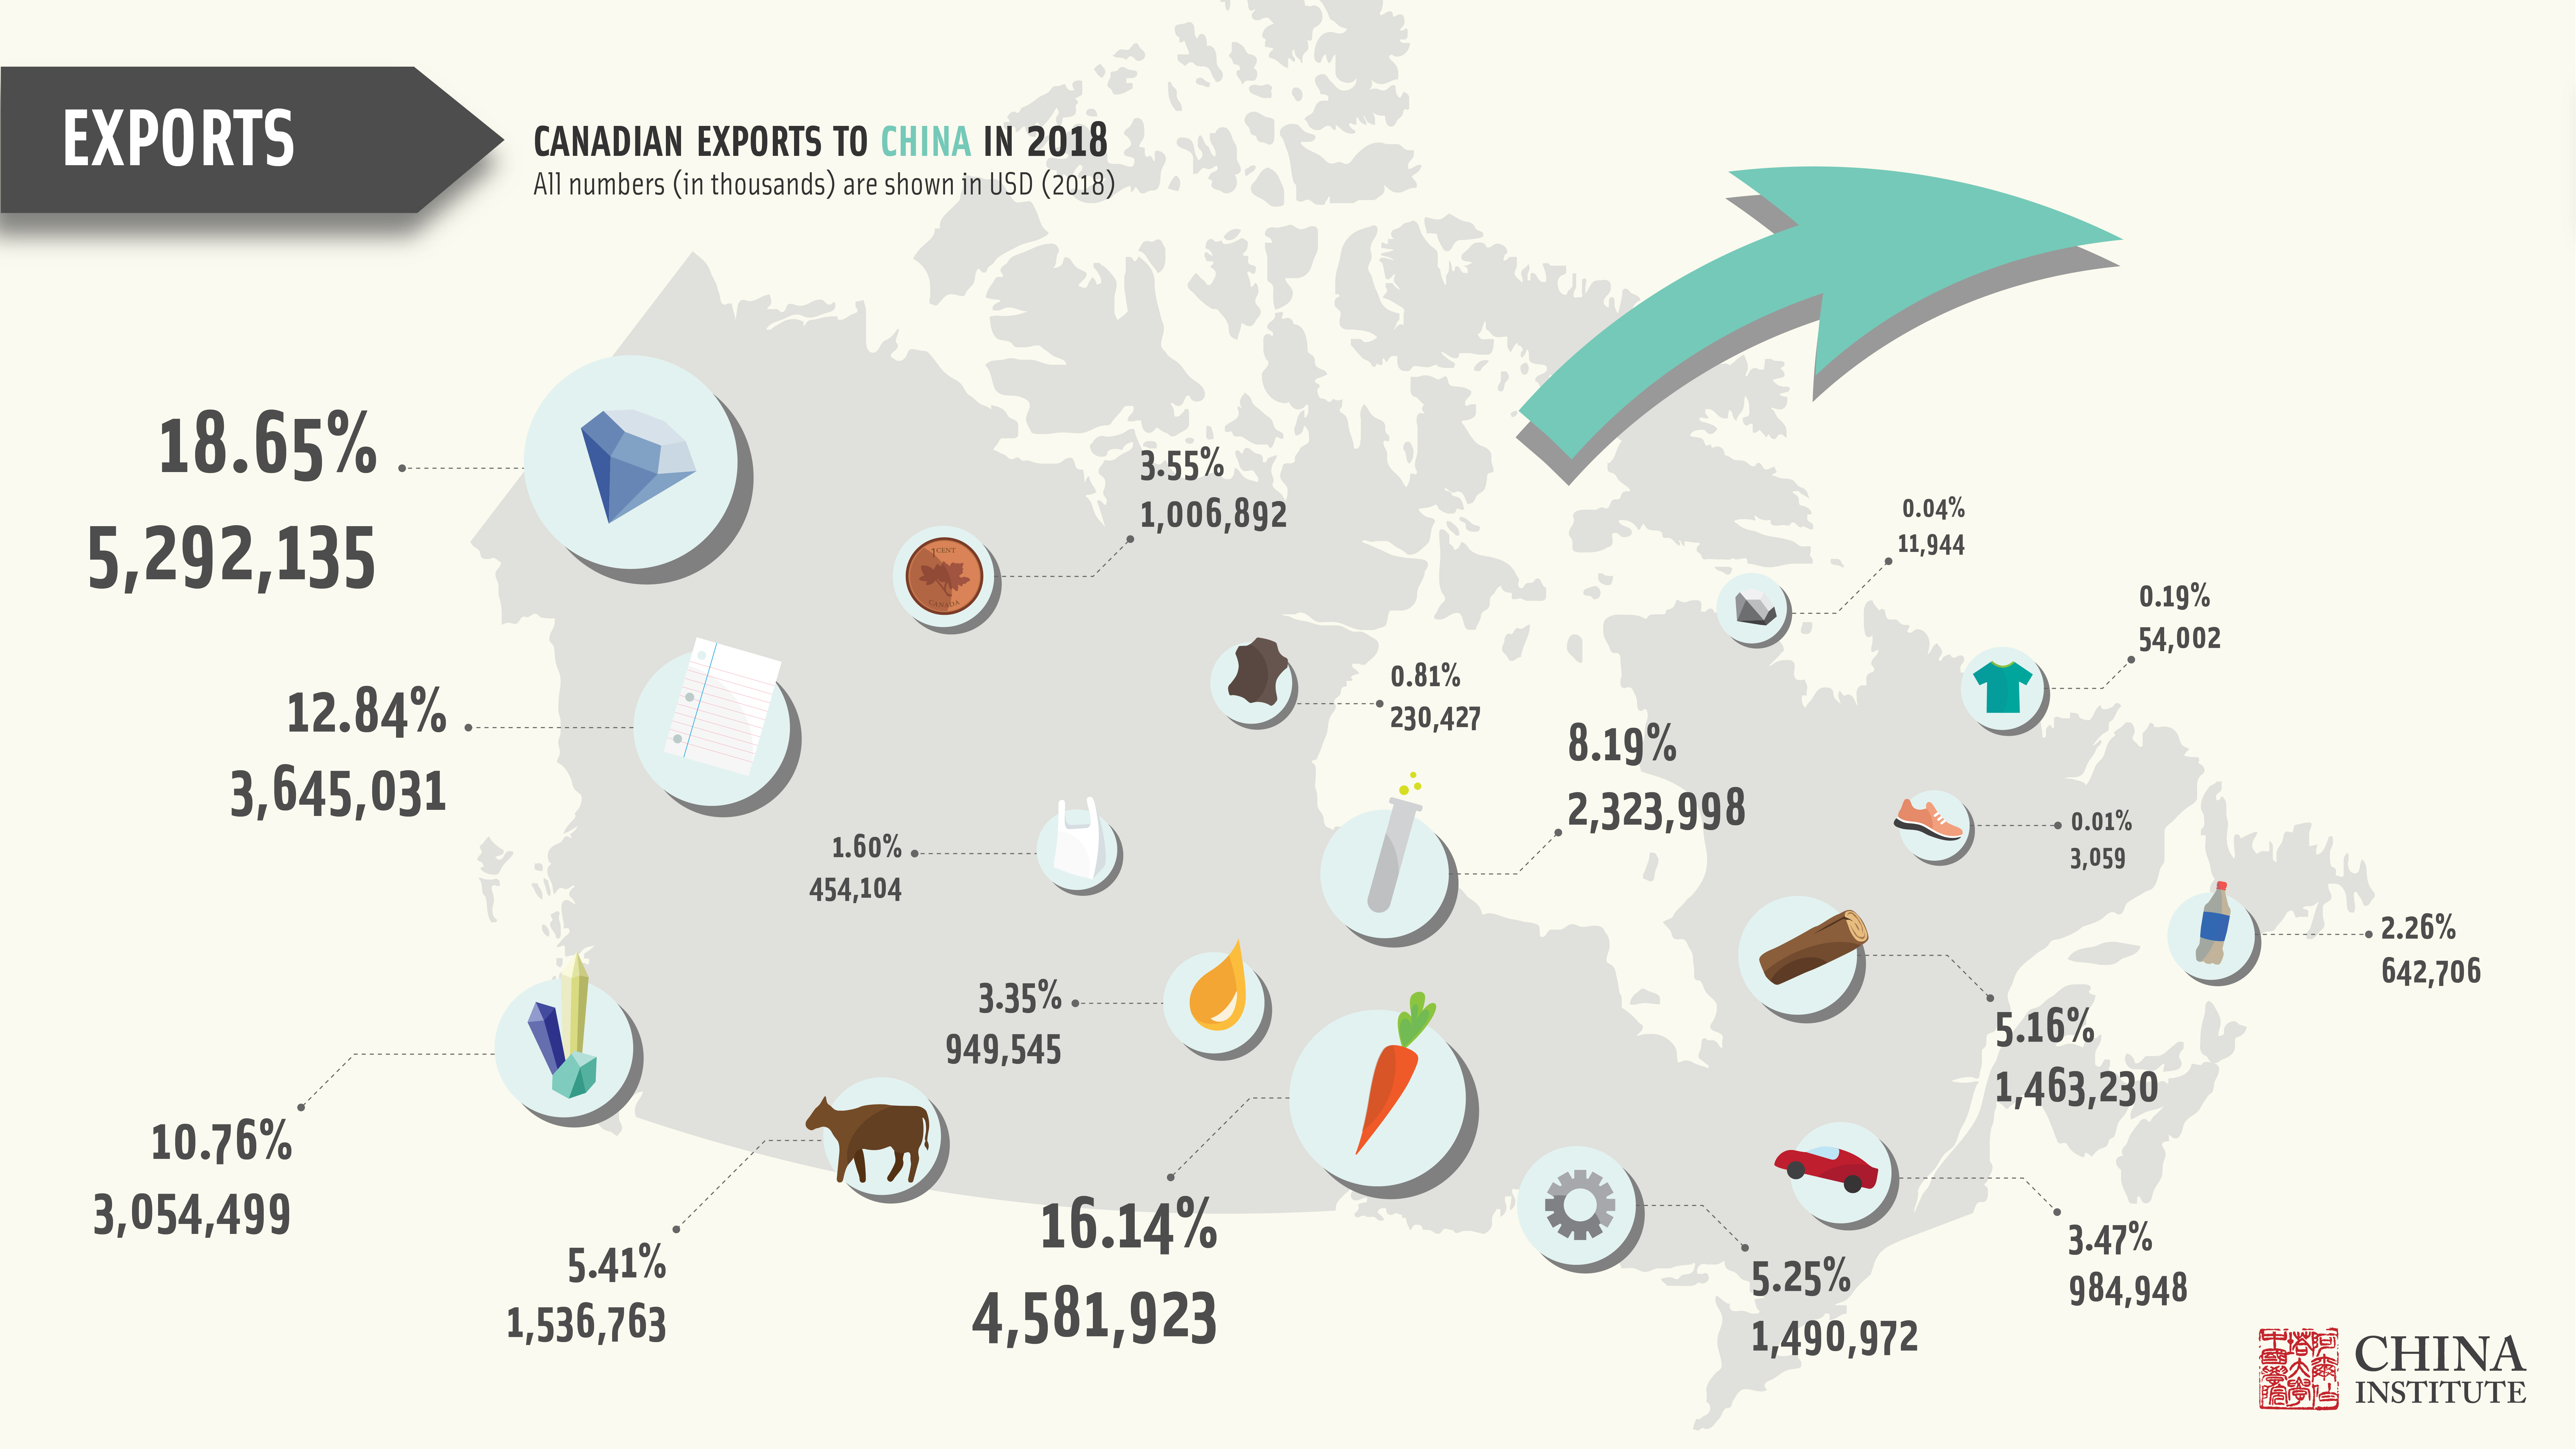
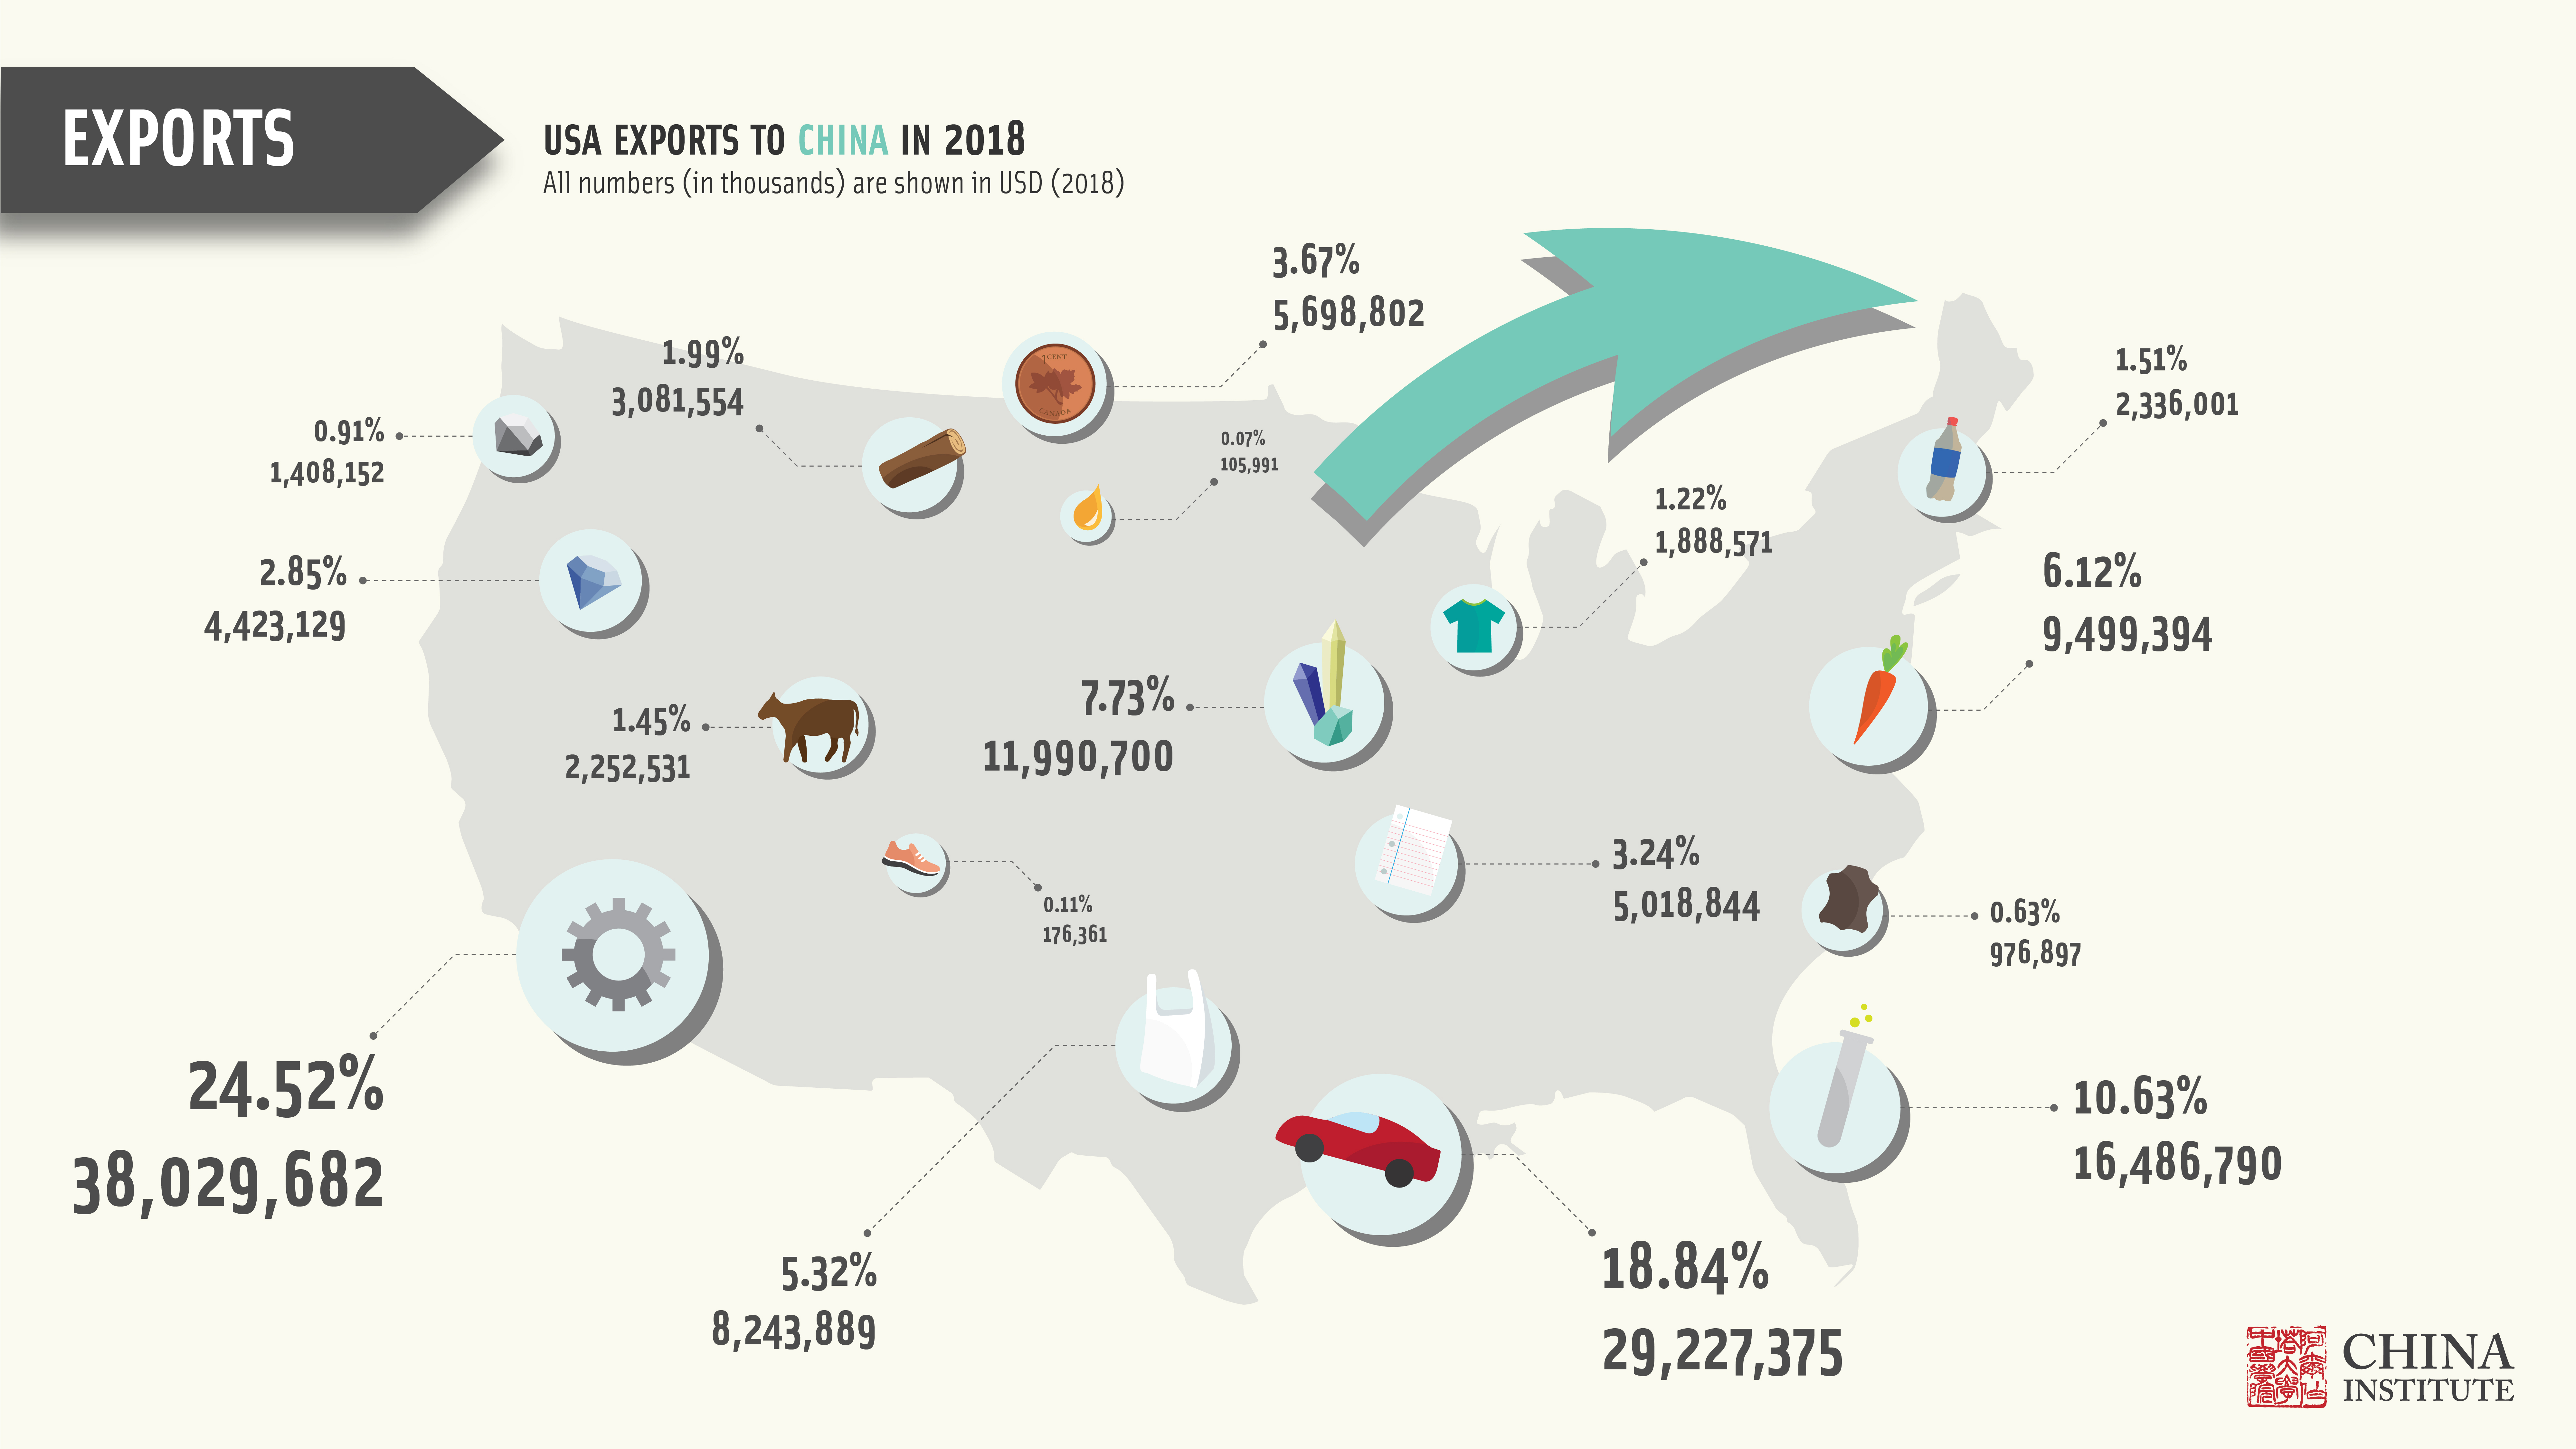
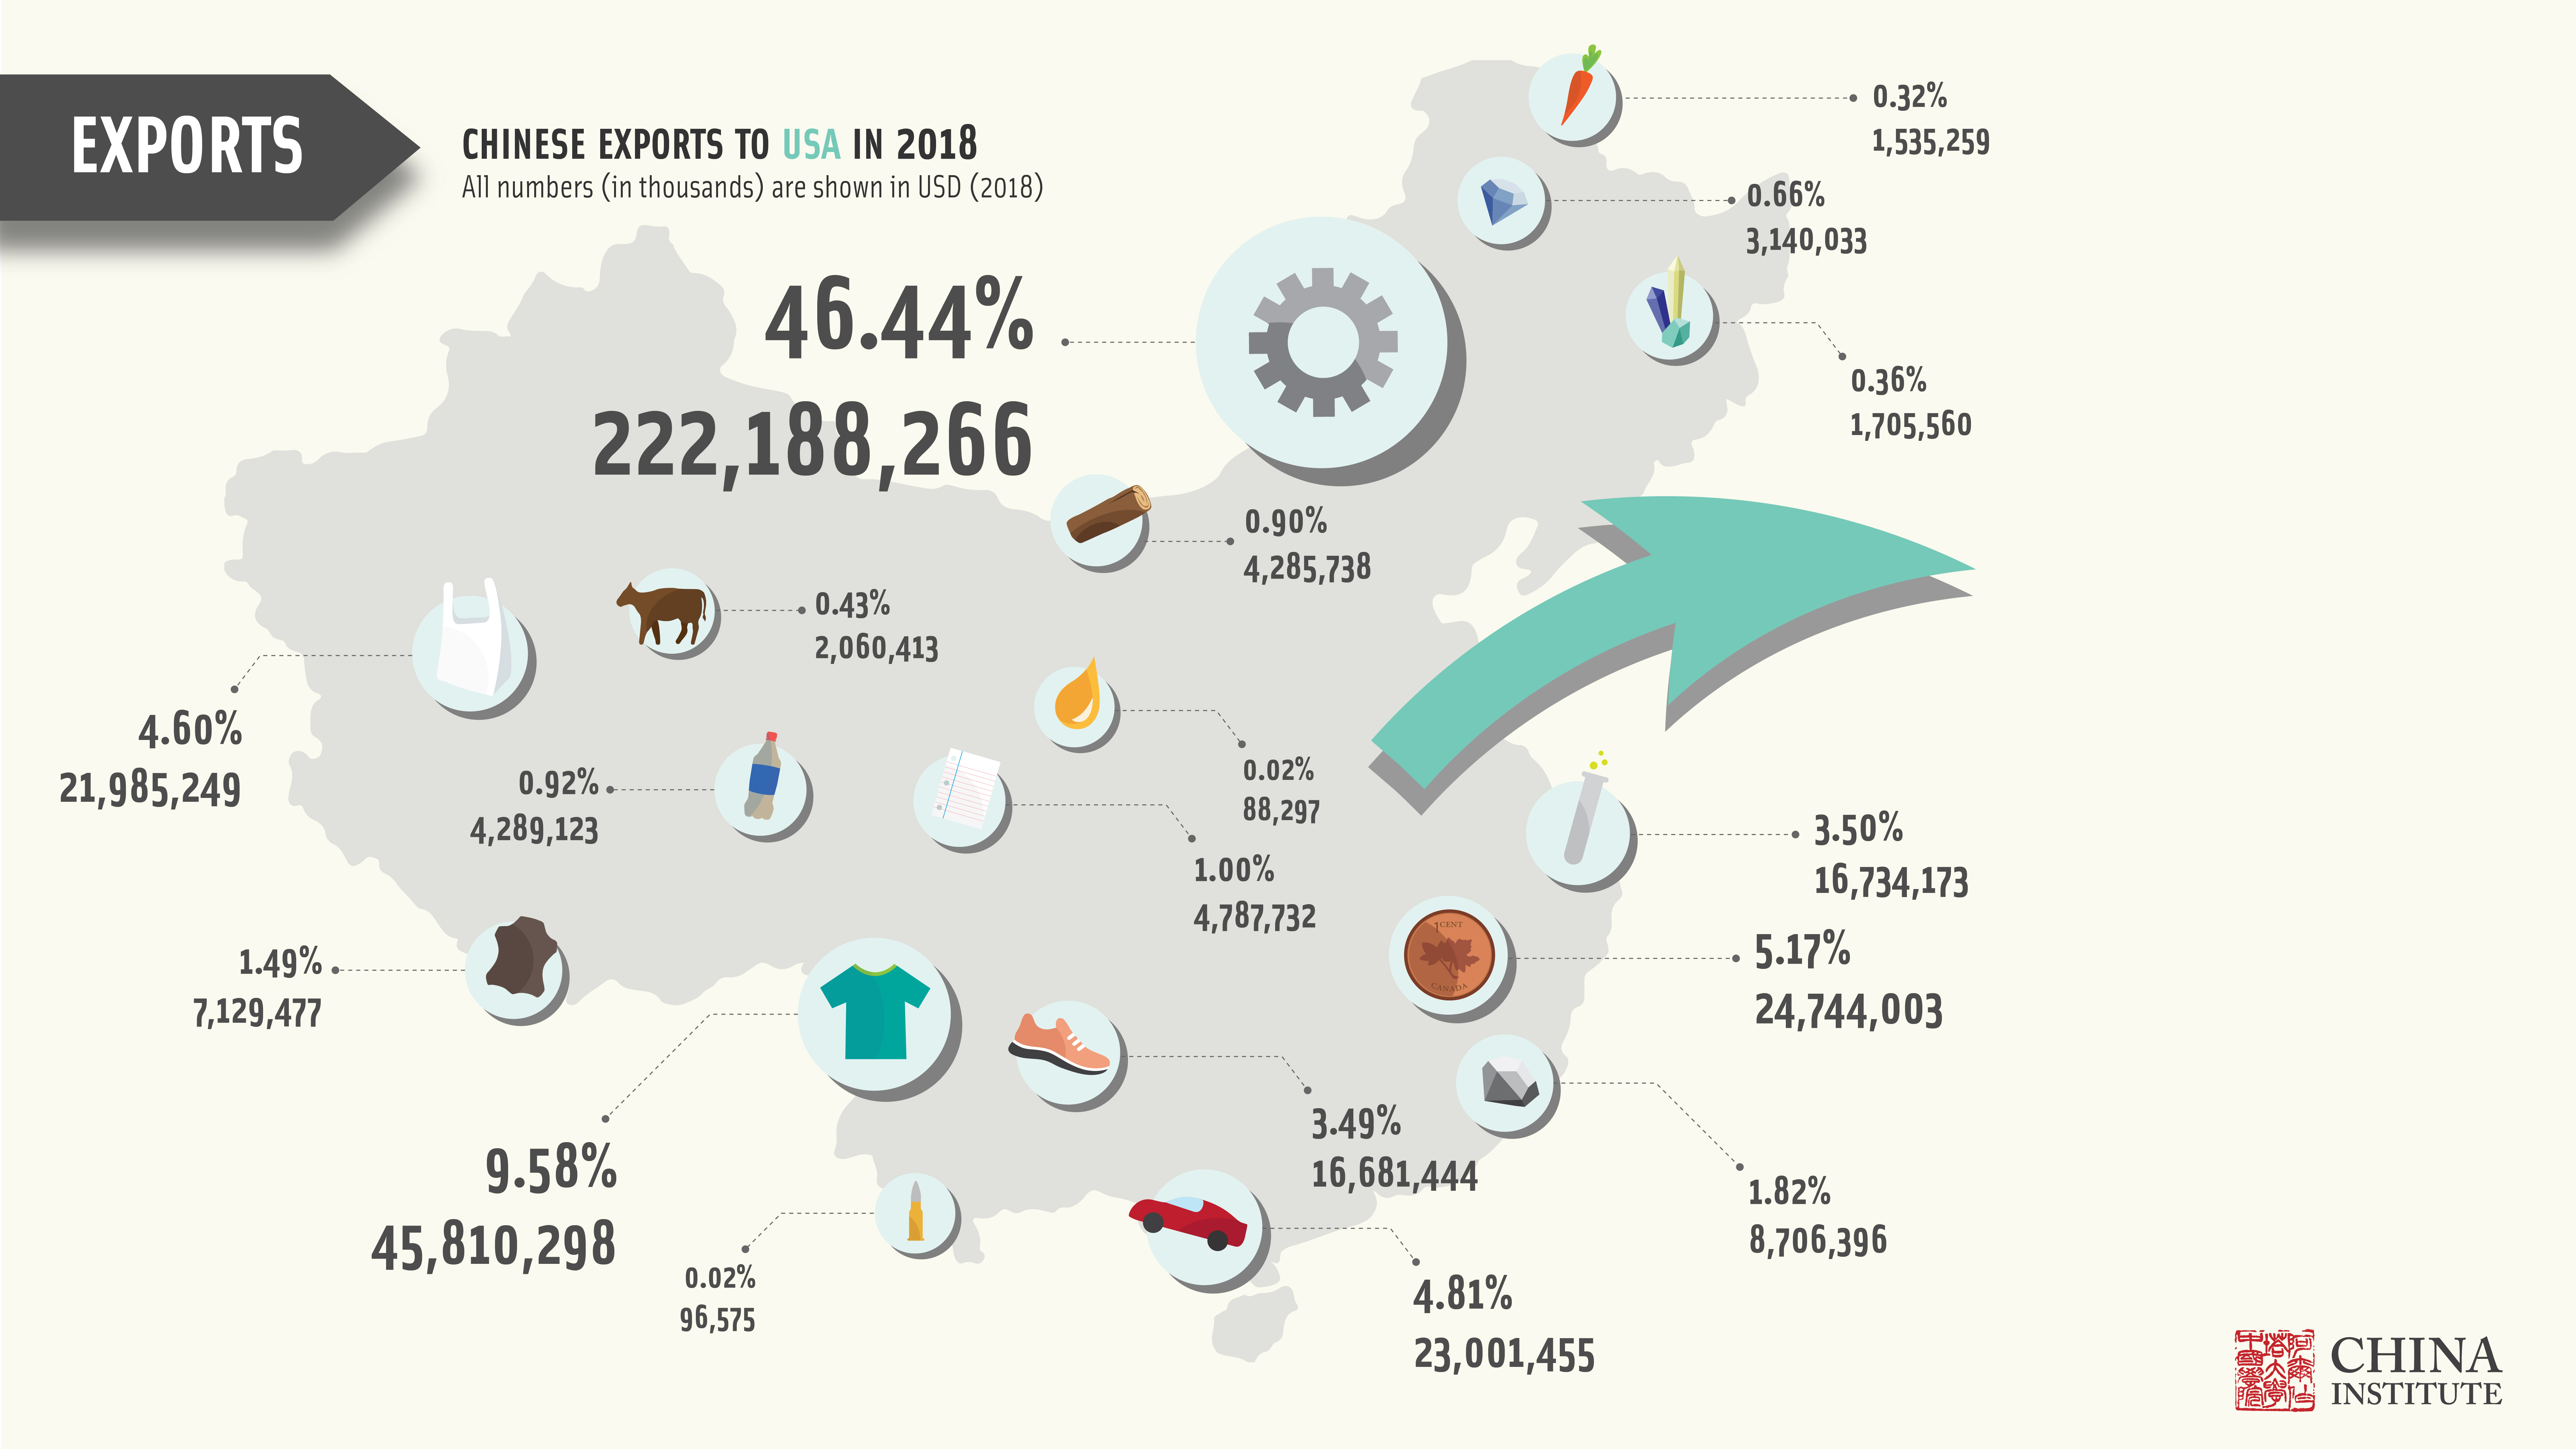
This data visualization of China’s trade with the US and Canada presents the key figures of US-China and Canada-China bilateral international trade in 2018, and breaks down the aggregate figures into different product categories to provide a more structured view regarding these complex trade details. The data are extracted from the General Administration of Customs (GAC, .|关总٨p) of the People’s Republic of China (PRC) and includes four types of figures: (1) Canada exports to China in 2018, (2) US Exports to China in 2018, (3) China exports to Canada in 2018 and (4) China export to US in 2018.
This data presentation is a part of the China Institute’s “China Numbers” series. The visualization facilitates a clear view of China’s bilateral trade relationship with two important trading partners. It highlights that Canada mainly exports agriculture products and primary commodities such as precious metals, pearls, mineral products, which differs from the trading pattern between the US and China. Meanwhile, both Canada and the US heavily import manufactured goods, such as machinery and mechanical appliances, and textiles from China. The primary aim of the “China Numbers” data visualization is to highlight official government data and convert it into an interesting visual that is easy to understand.

Research Team
Dr Scott N Romaniuk, Postdoctoral Research Fellow; Liang Ma, Research Associate; Xiaowen Zhang, Research Associate
Design
Genevieve Ongaro, Design and Communications Specialist